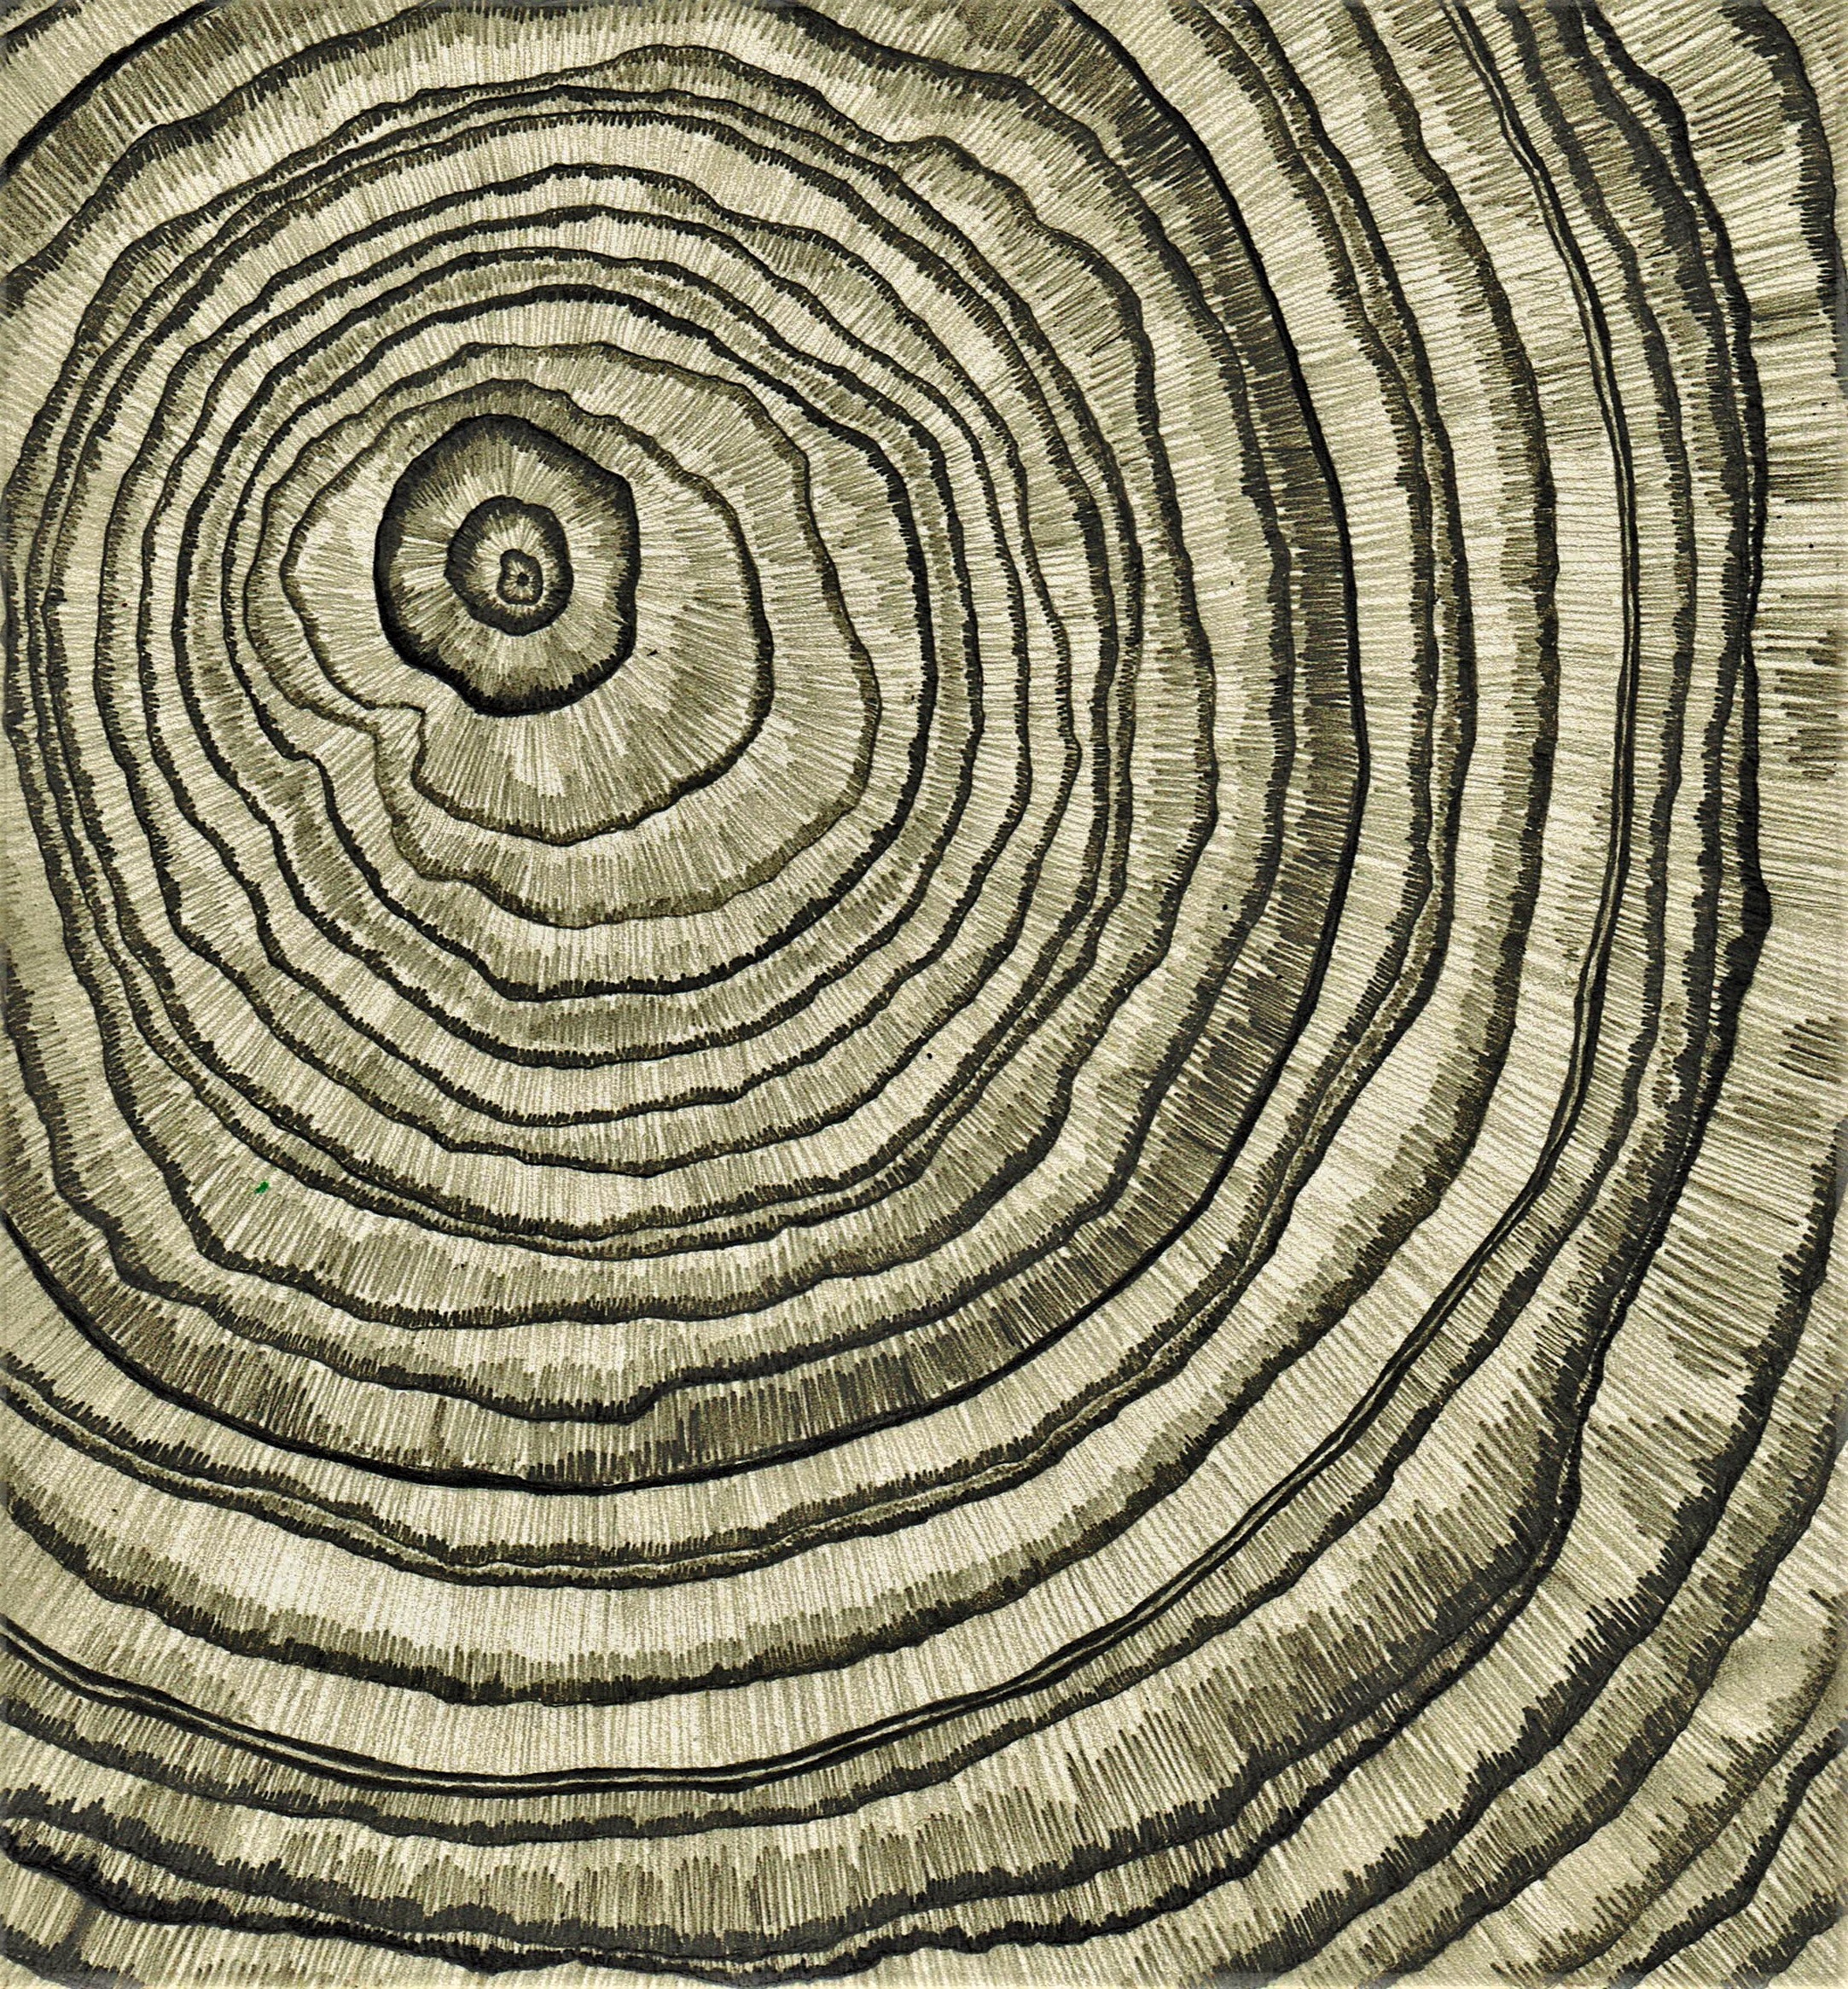
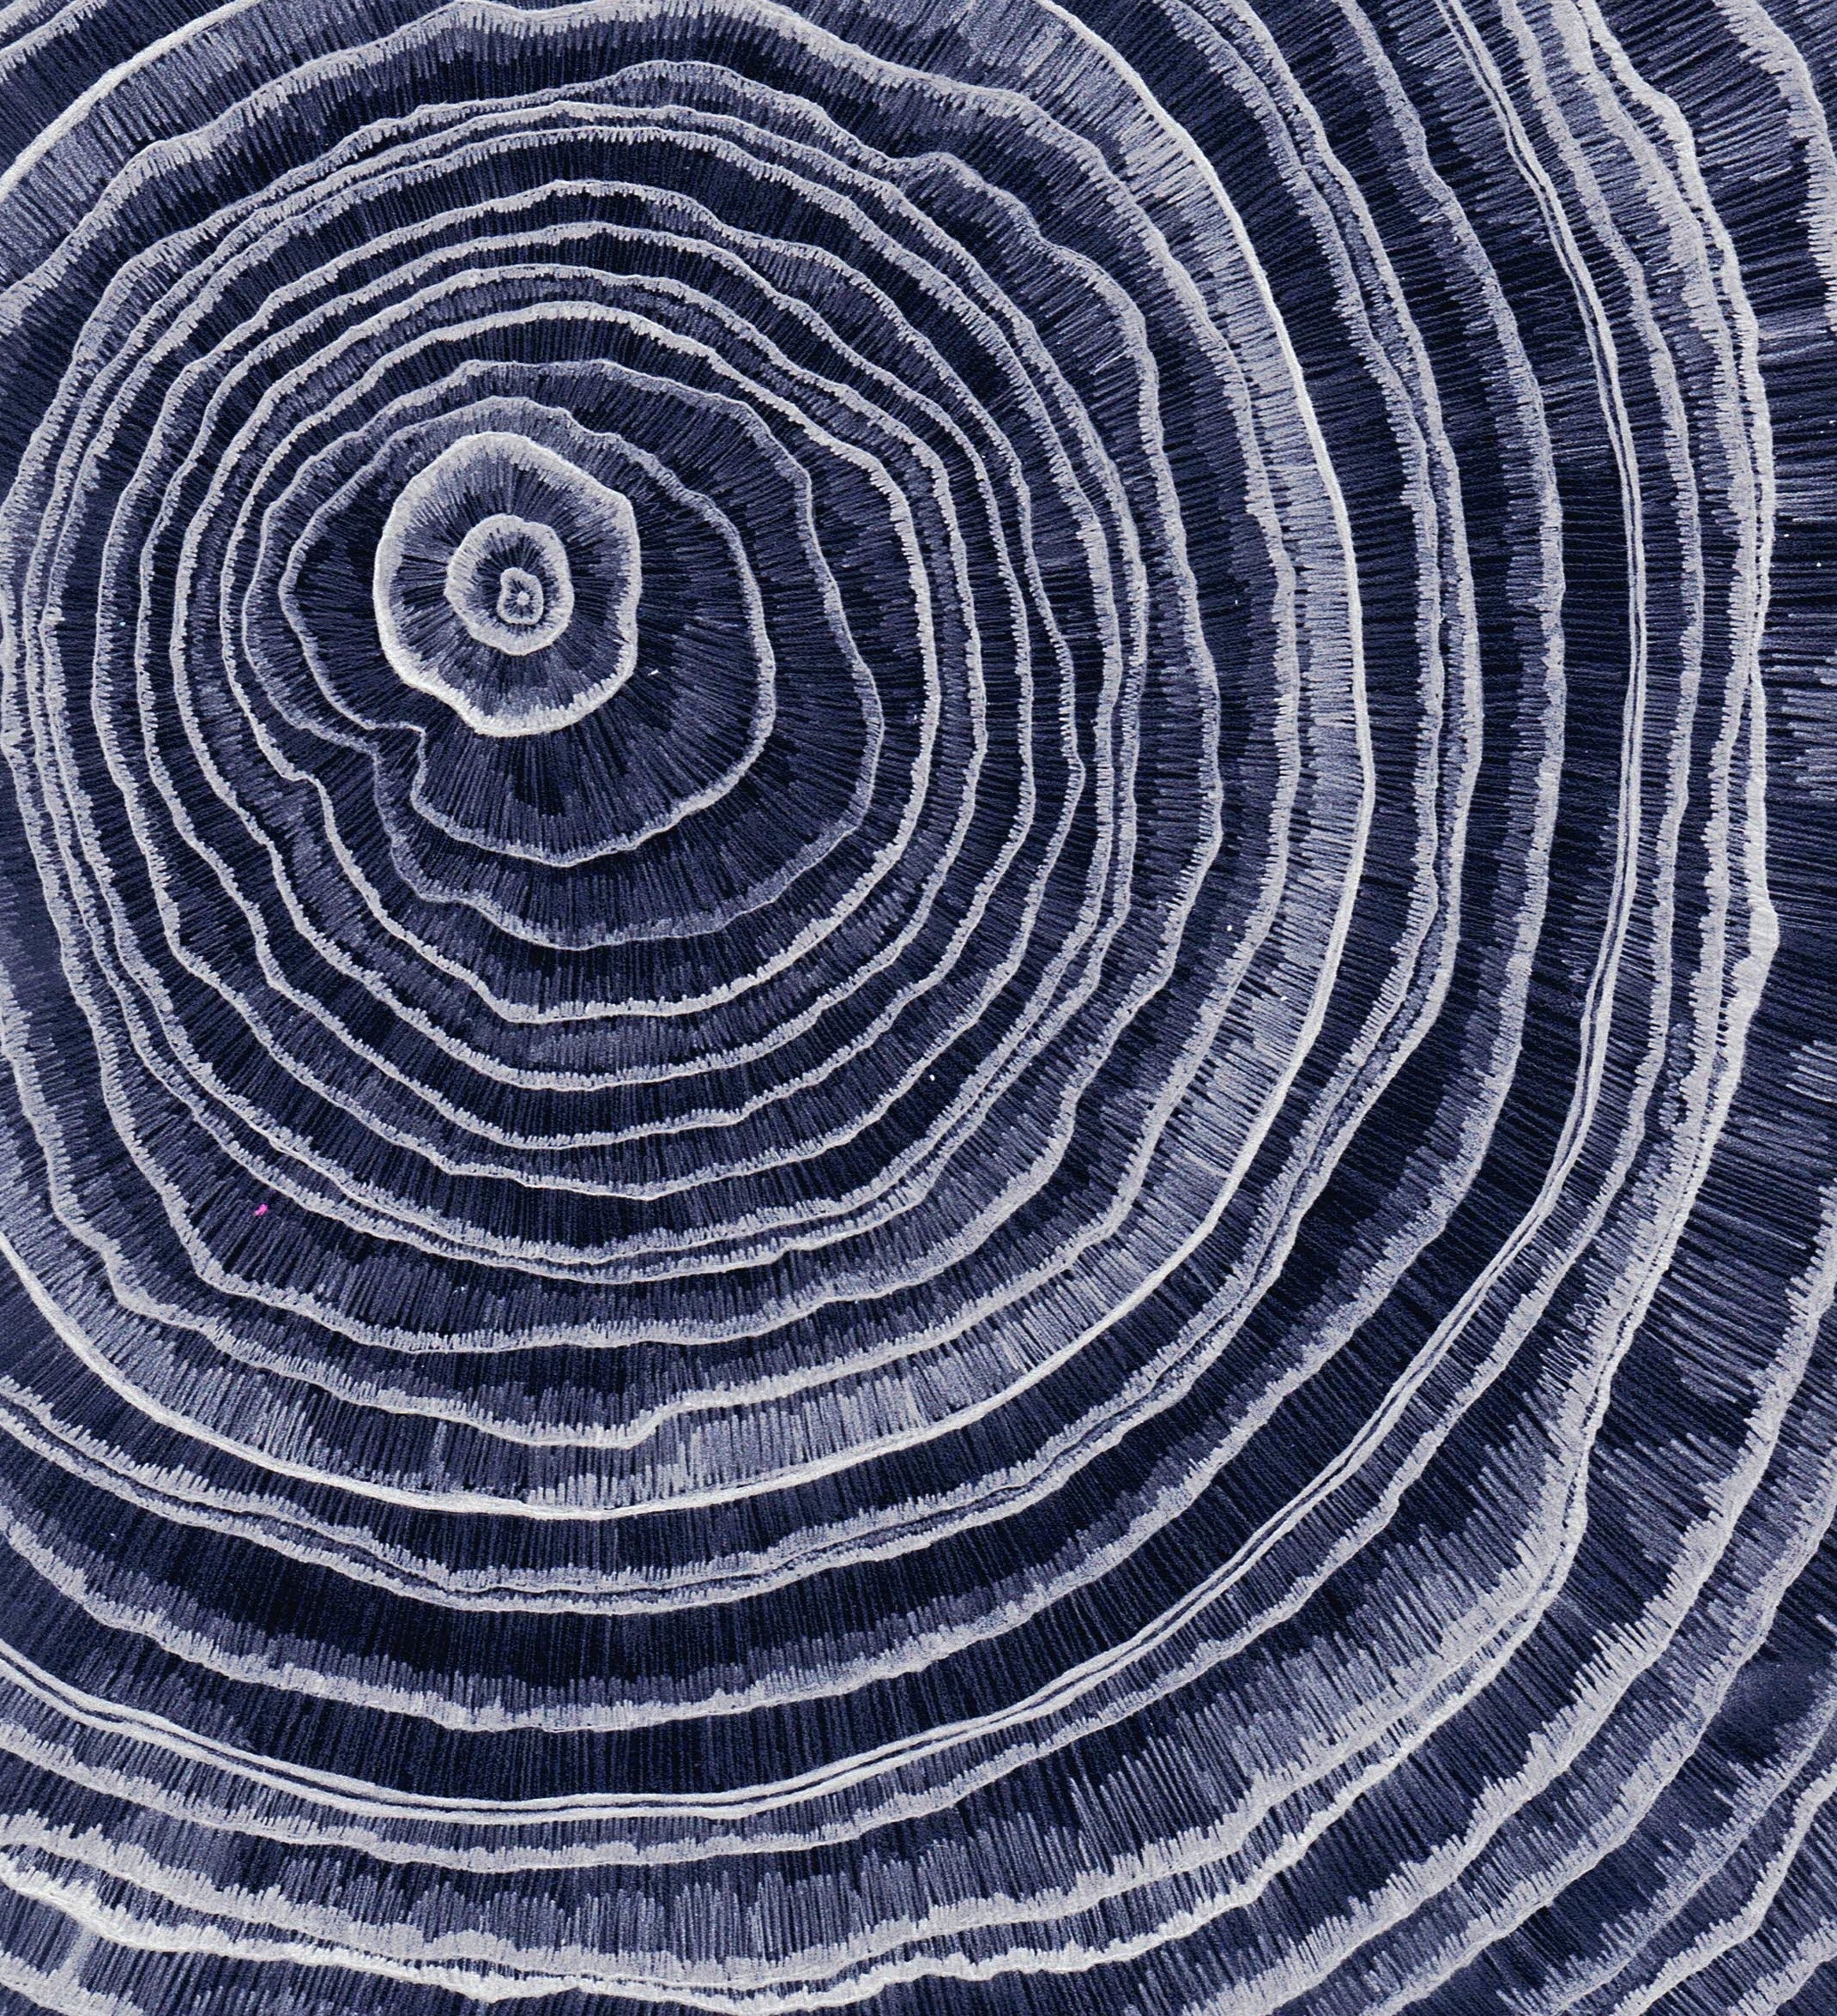
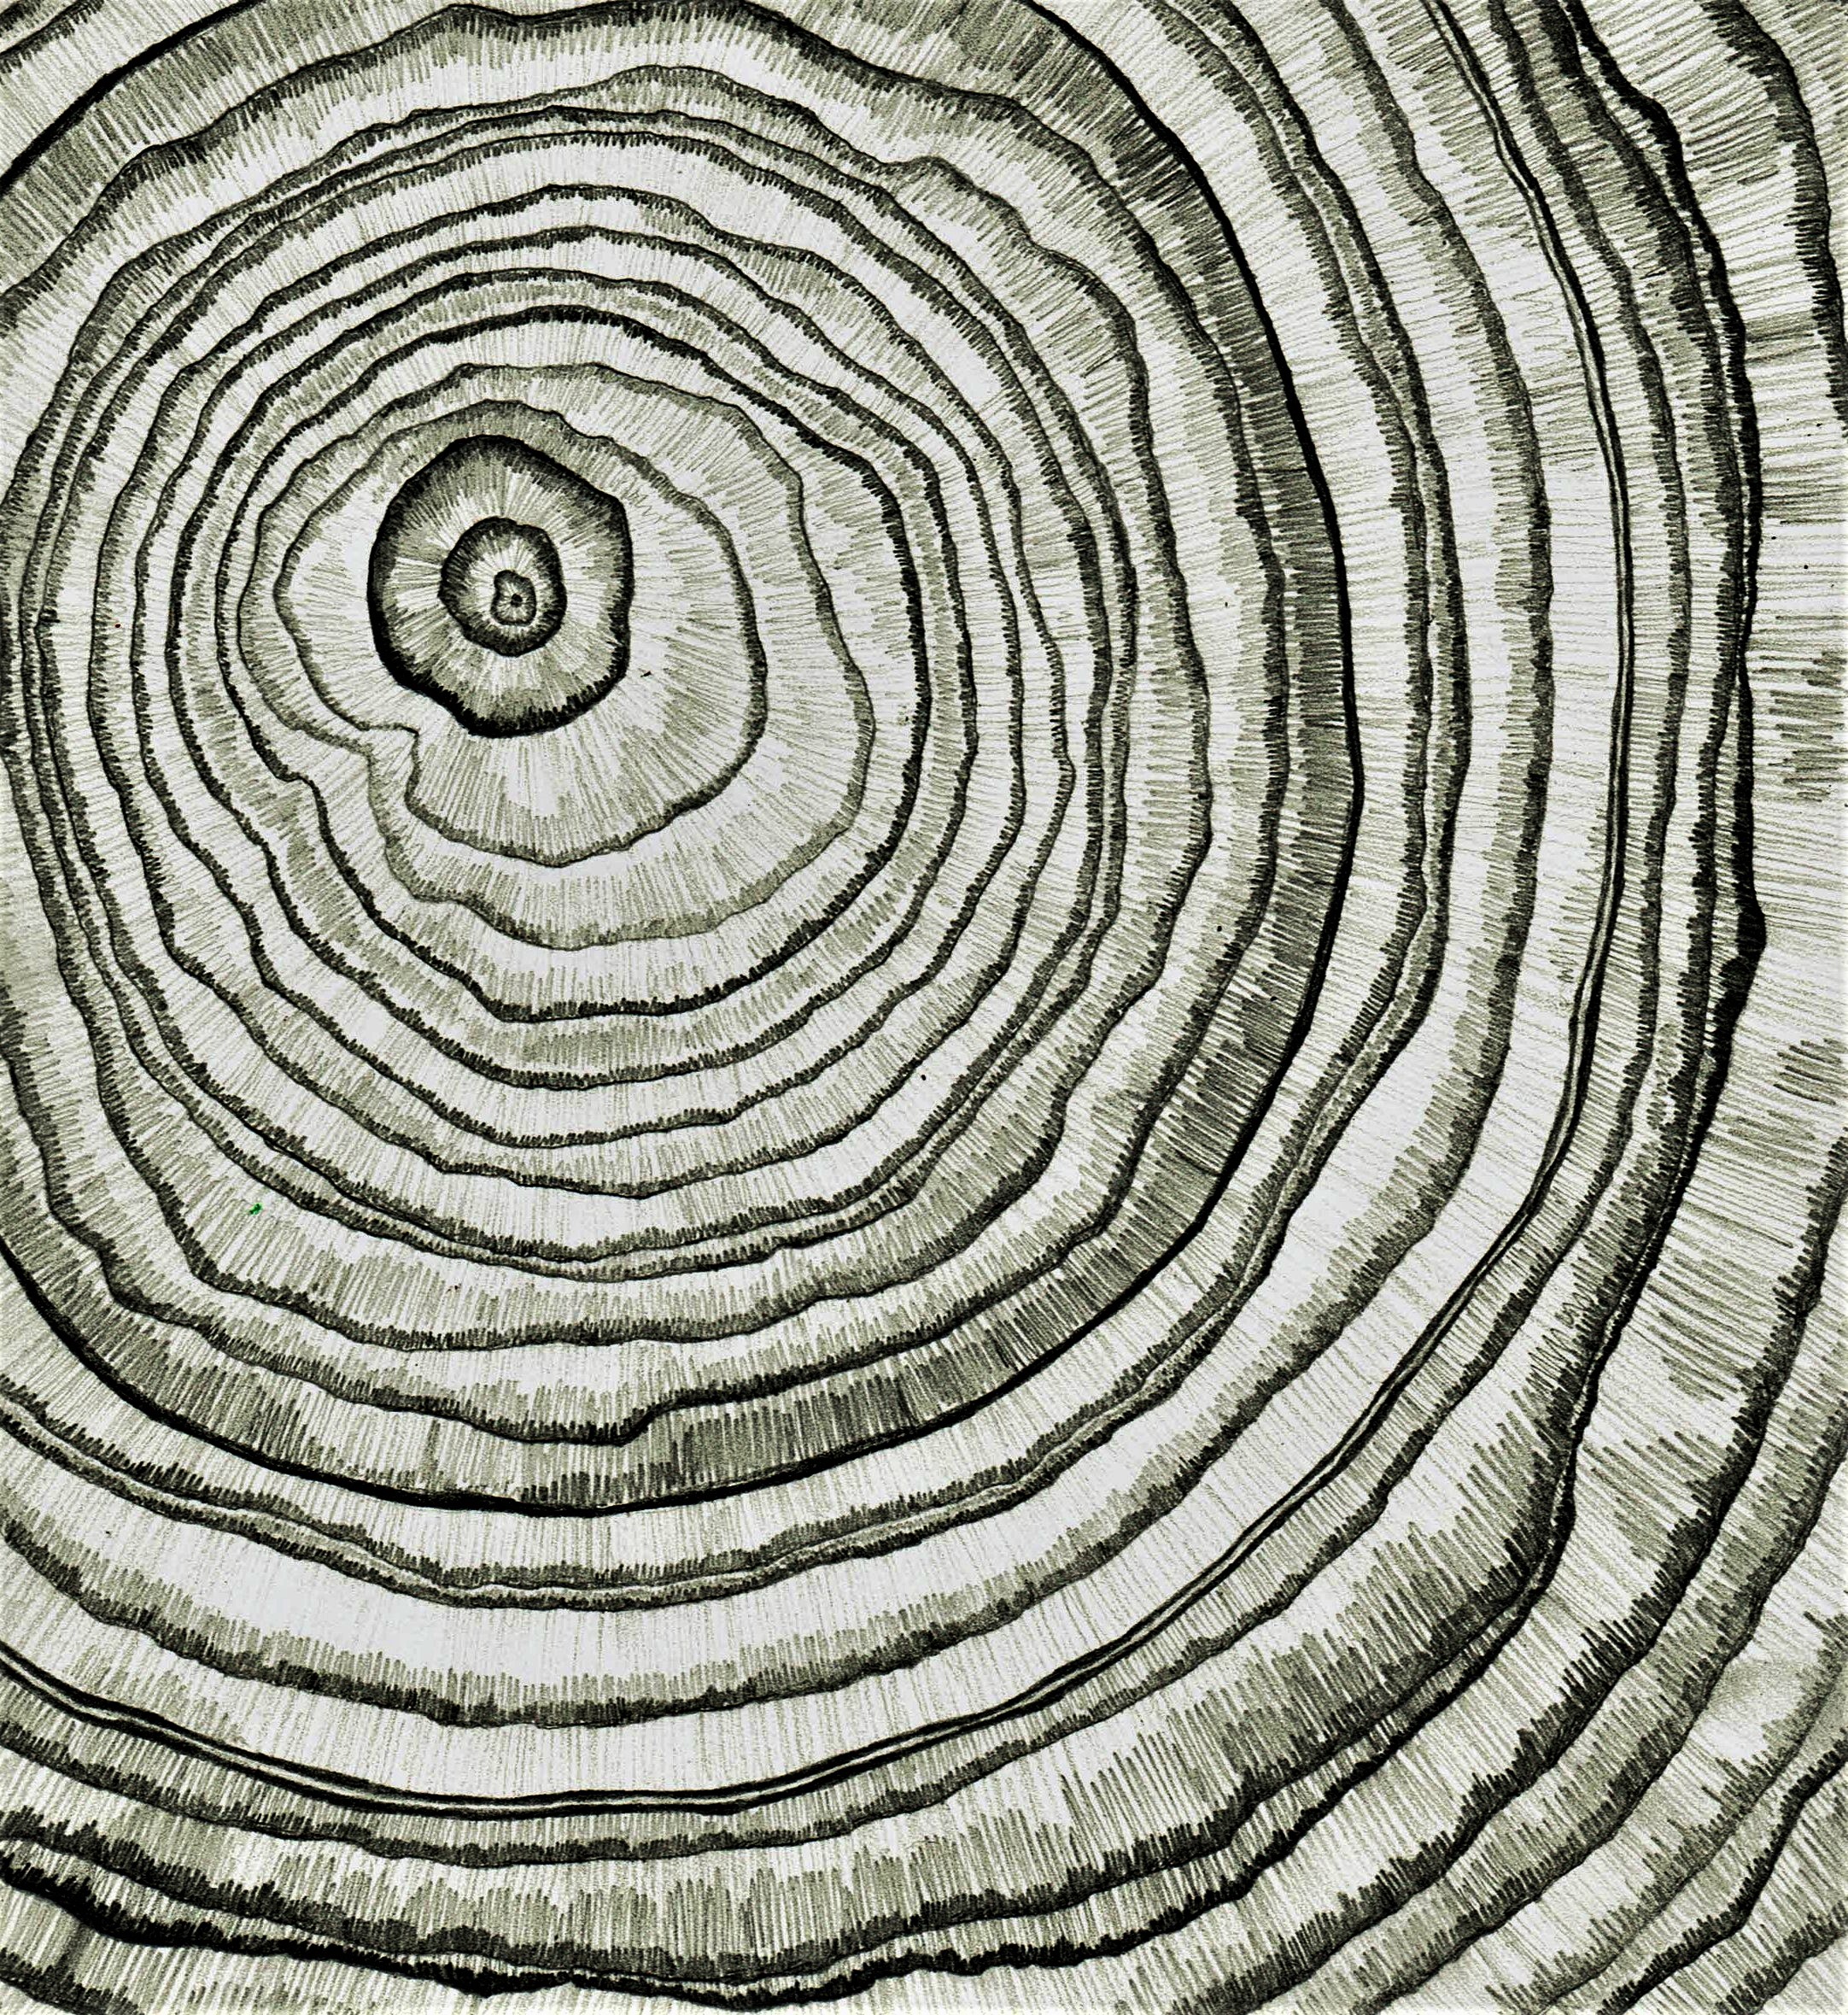
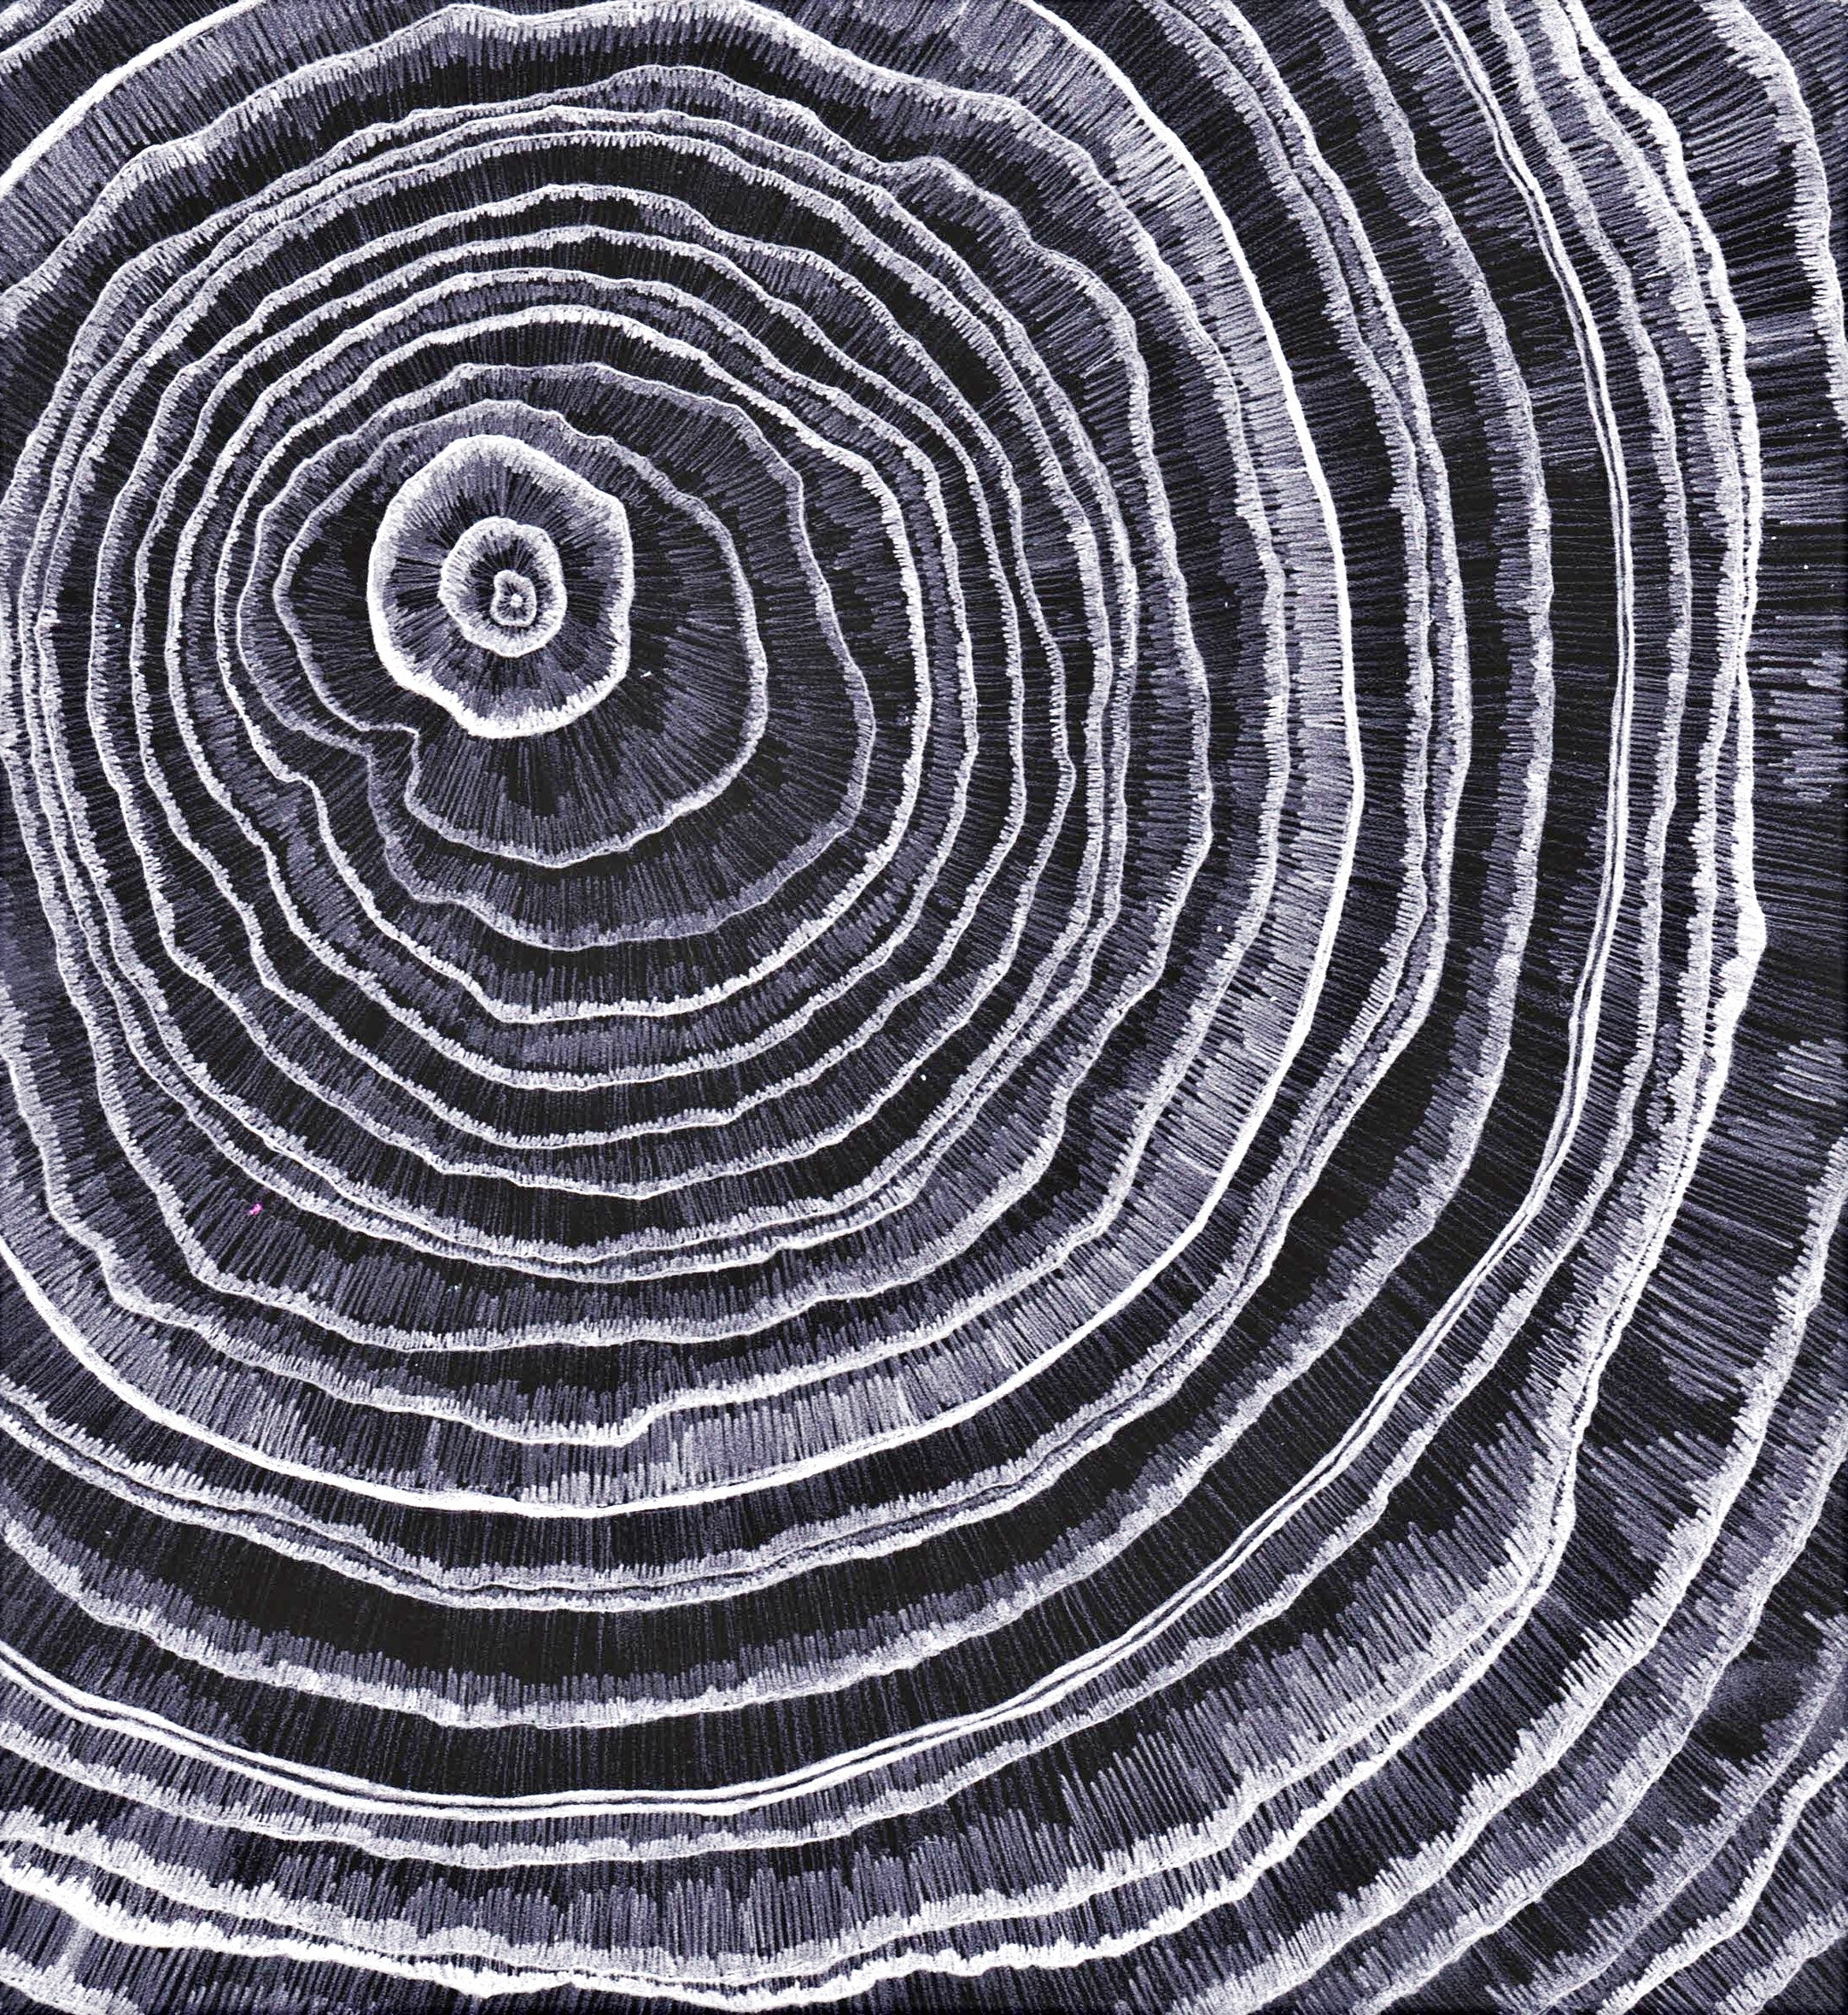
Following on from my coral sketch I also did a sketch of some tree rings, mainly just running with the same idea of deep storage in nature: tree rings can store climate data in much the same way coral does. Admittedly the sketch does not further the project much conceptually as it is simply just exploring the same idea again, but I notice that often with my work I will get caught up on trying to push the project forward conceptually without generating much physical work so this was in some ways just trying to counteract this problem. As can be seen below I have again experimented with inverting and adjusting the image digitally, which does create some interesting variations.
I enjoy the intricate detail that can be seen in each stripe – it is suggestive of some kind of encoded, encrypted data, and the variation from ring to ring enhances this idea. Although it is fairly obviously tree rings I also like how, as with the coral, the pattern itself is somewhat abstract, removed from any context, so is open to be interpreted in this purely scientific way. Perhaps to further this idea I could begin to study/research more in-depth what the different visual reactions are to climactic conditions so that my pieces could start to contain actual data rather than just the generic notion of data. This in fact links to a project on personal data that I did on my Foundation course where we had to create maquettes from data we had collected about ourselves, so it could be good to look back at this and explore some of these ideas again but through this scientific/natural visual mode. (https://annaharrisfoundation.wordpress.com/2018/11/27/data-visualisation-3d/) The pieces would also gain more meaning if they were representations of real life data, and I could then go on to explore this in media other than just drawing/printing (perhaps more digital?).

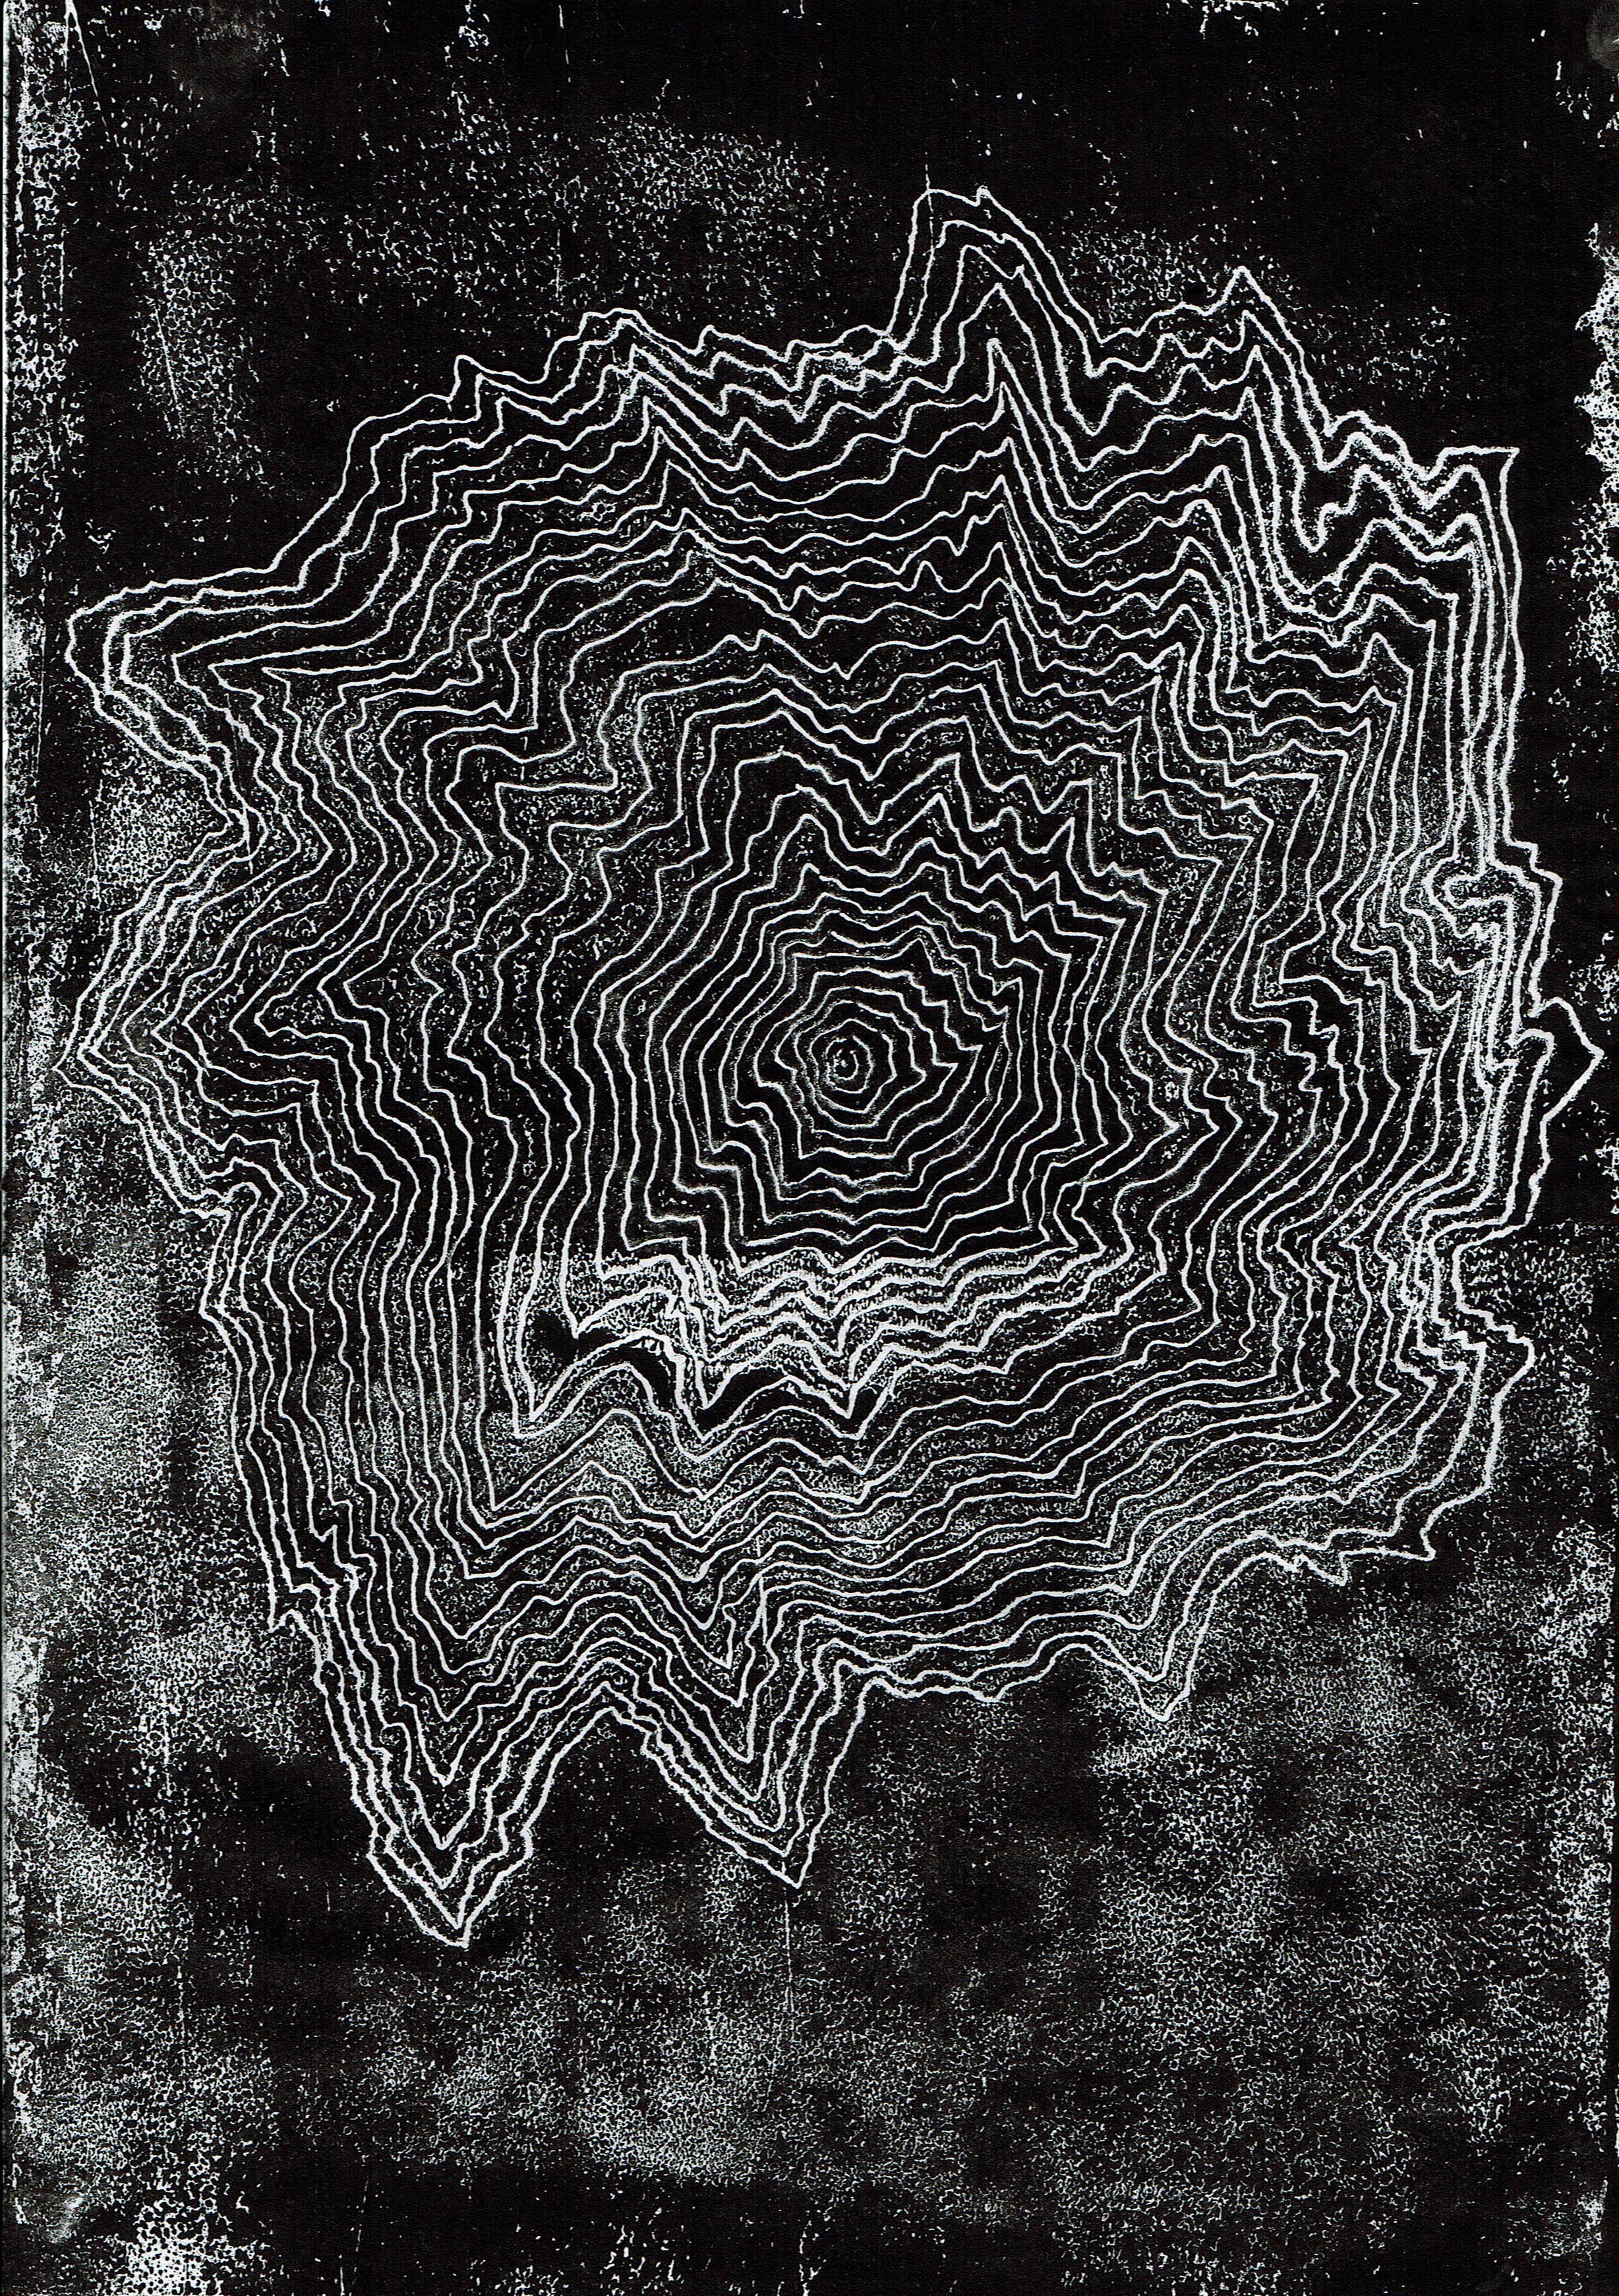
I also did some monoprinting as I find it a great way to generate a lot of work fairly quickly and work through several different ideas in one sitting. At the moment I do feel the project is going a little slowly as I’m fairly busy with other things, however I should remember that this doesn’t just have to be a summer project, I will have lots of freedom over my subject matter once I start my degree so I don’t necessarily have to create an entire cohesive project by the end of summer!
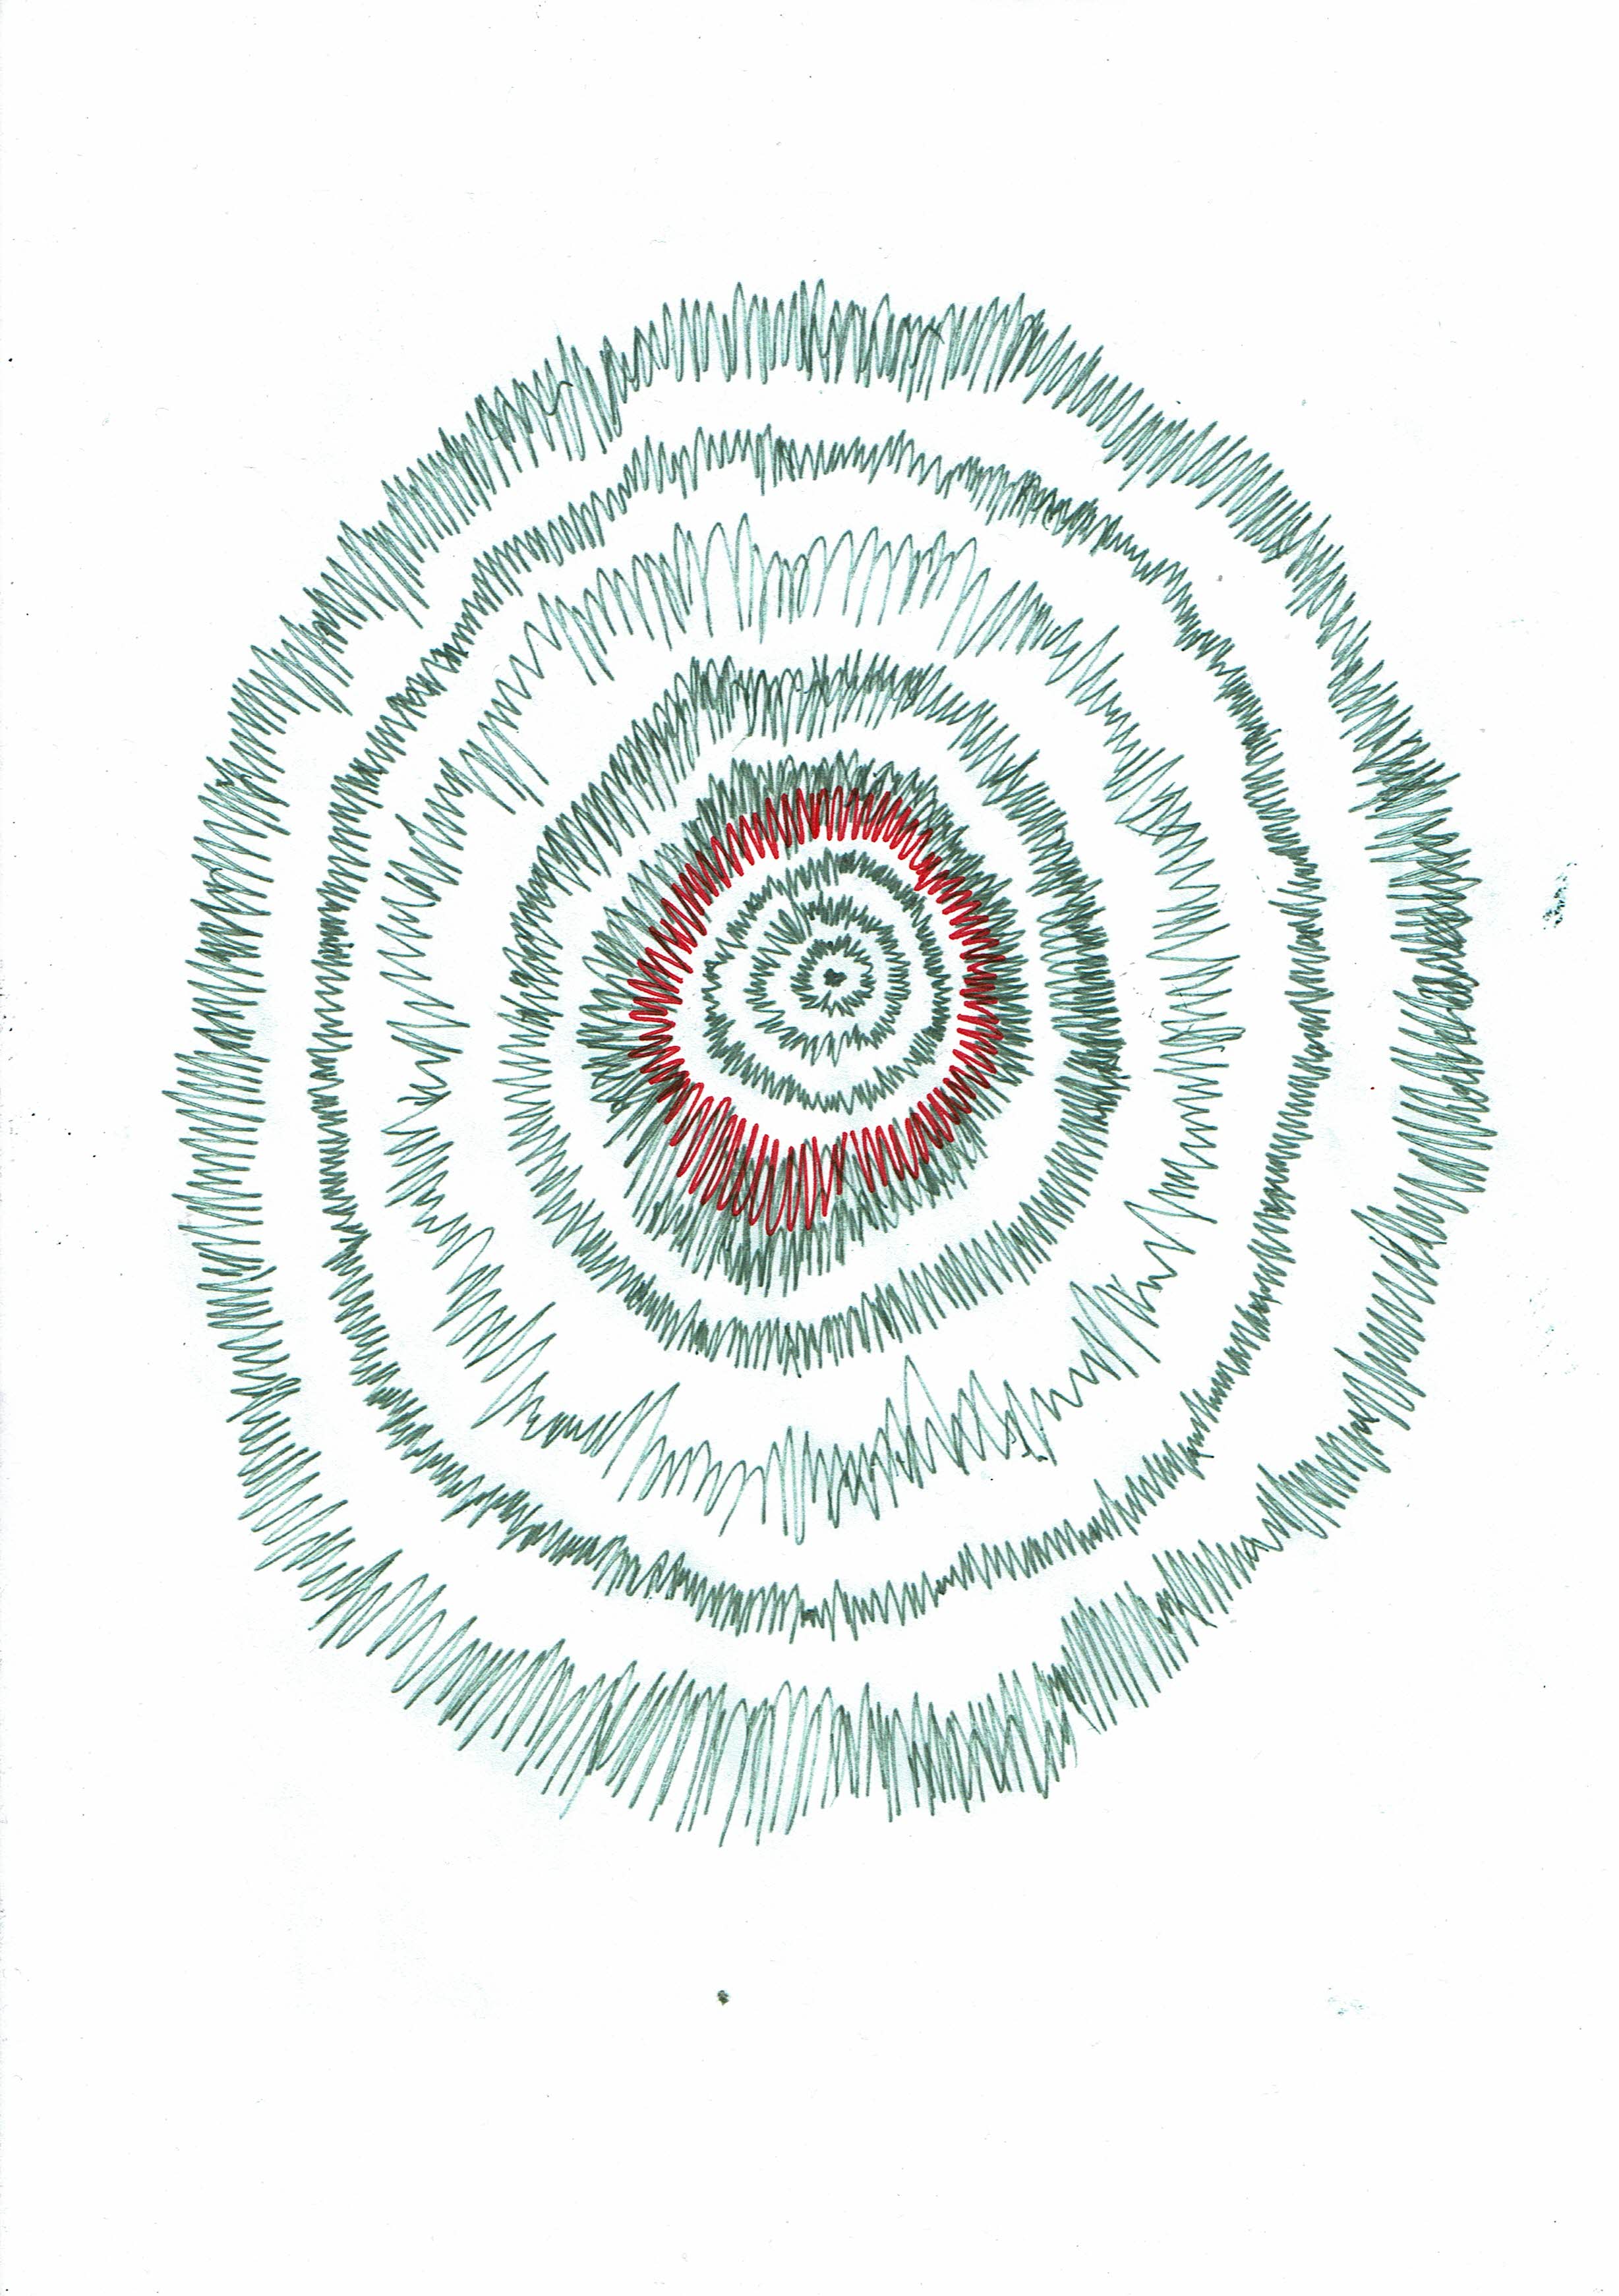
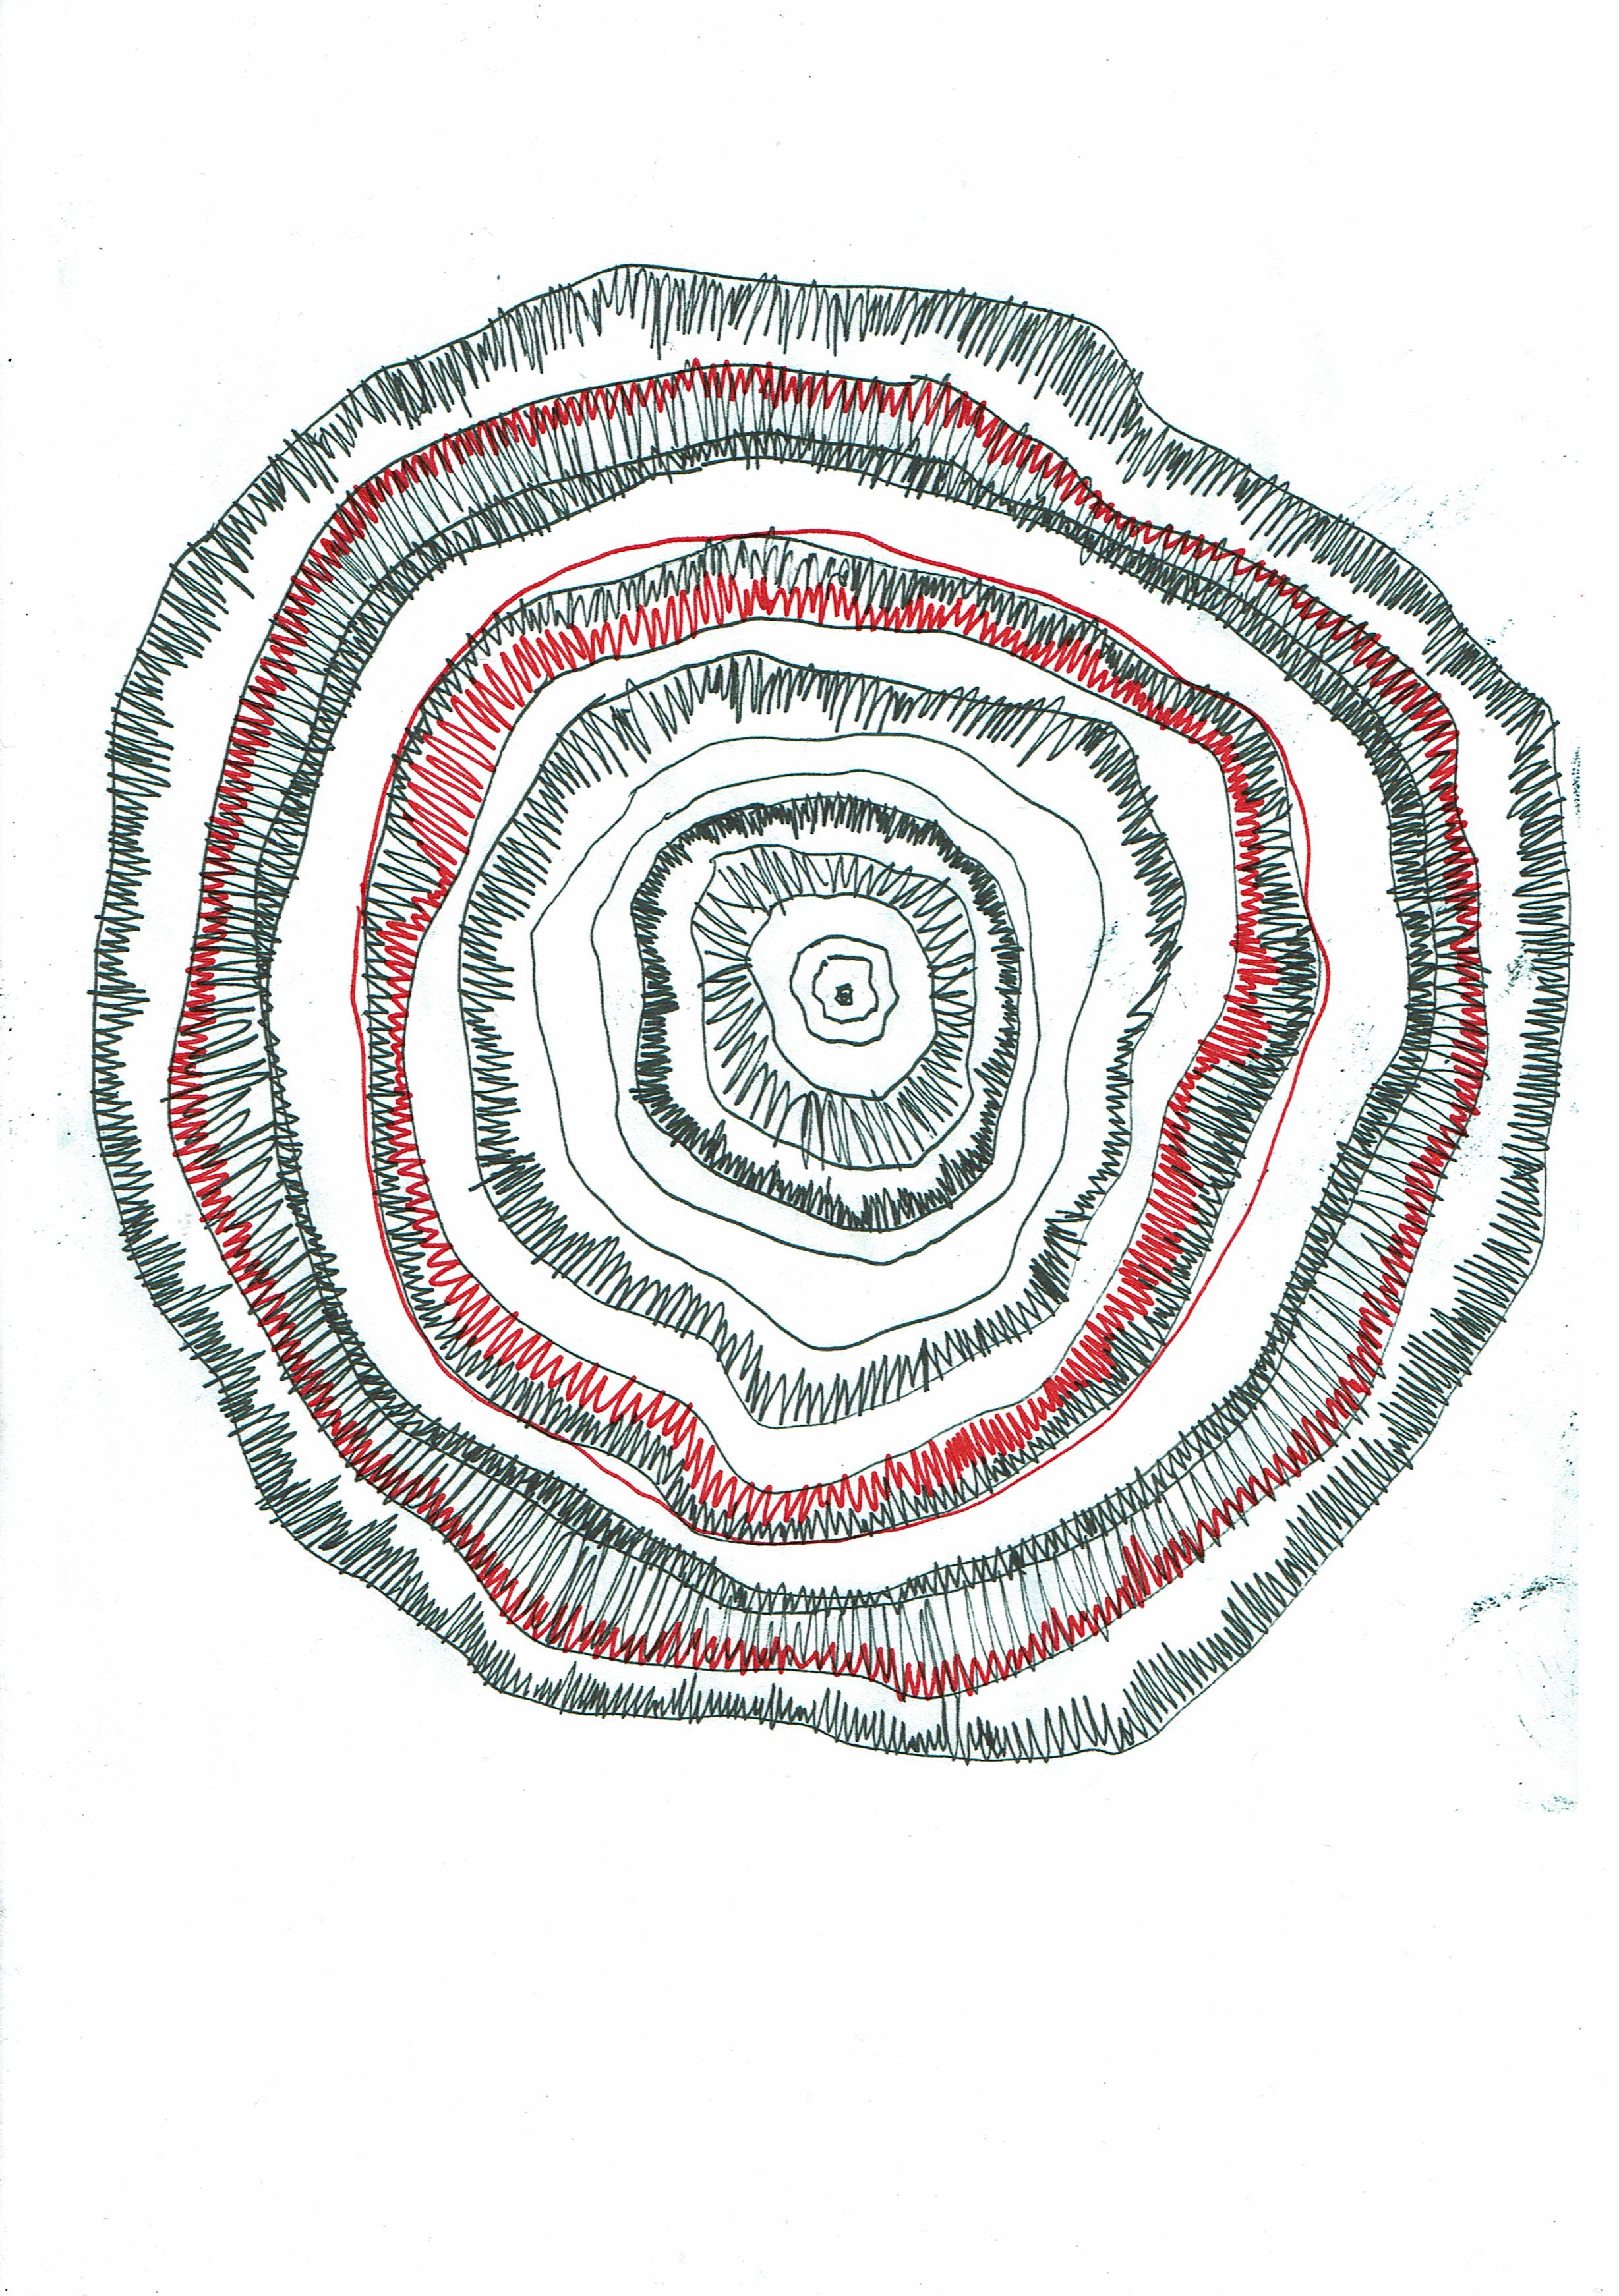
I tried a variety of approaches with my prints: I started with simply drawing concentric circles as just a bit of a warm-up, and I do enjoy the simplicity of these prints (for most prints I have scanned in the monoprint, the ghost print and sometimes the drawing as well from the back of the print). I also then tried the same idea again but with circles more reminiscent of a line on a graph, with peaks and troughs. Again, I did like these prints but I found the layers were fighting with each other a bit, so for the next print I used the peaks and troughs from one layer to inform the next. Not only is this print successful visually (particularly the ghost print), but I also like the idea that the smallest bumps in the inner circles become magnified as the rings grow outwards. I therefore replicated this idea with my next print, using the same principle but simply with linear lines making their way up the page. This print would possibly have been more successful if I had been able to work faster as it took me so long that the ink started to try as I worked my way up the page. Nonetheless I do like the result as, although the pattern is slightly disturbed by the noise of the print, it is these unpredictable imperfections in the results that really draws me to monoprinting in the first place.
After this I then mainly went on to experiment with different iterations of circles and textures, trying slightly different amounts of ink and slightly different shapes, just playing around with how they came out. I can’t think of much to say about these ones conceptually, they were mainly just visual experiments, but perhaps I will come back to them later on.


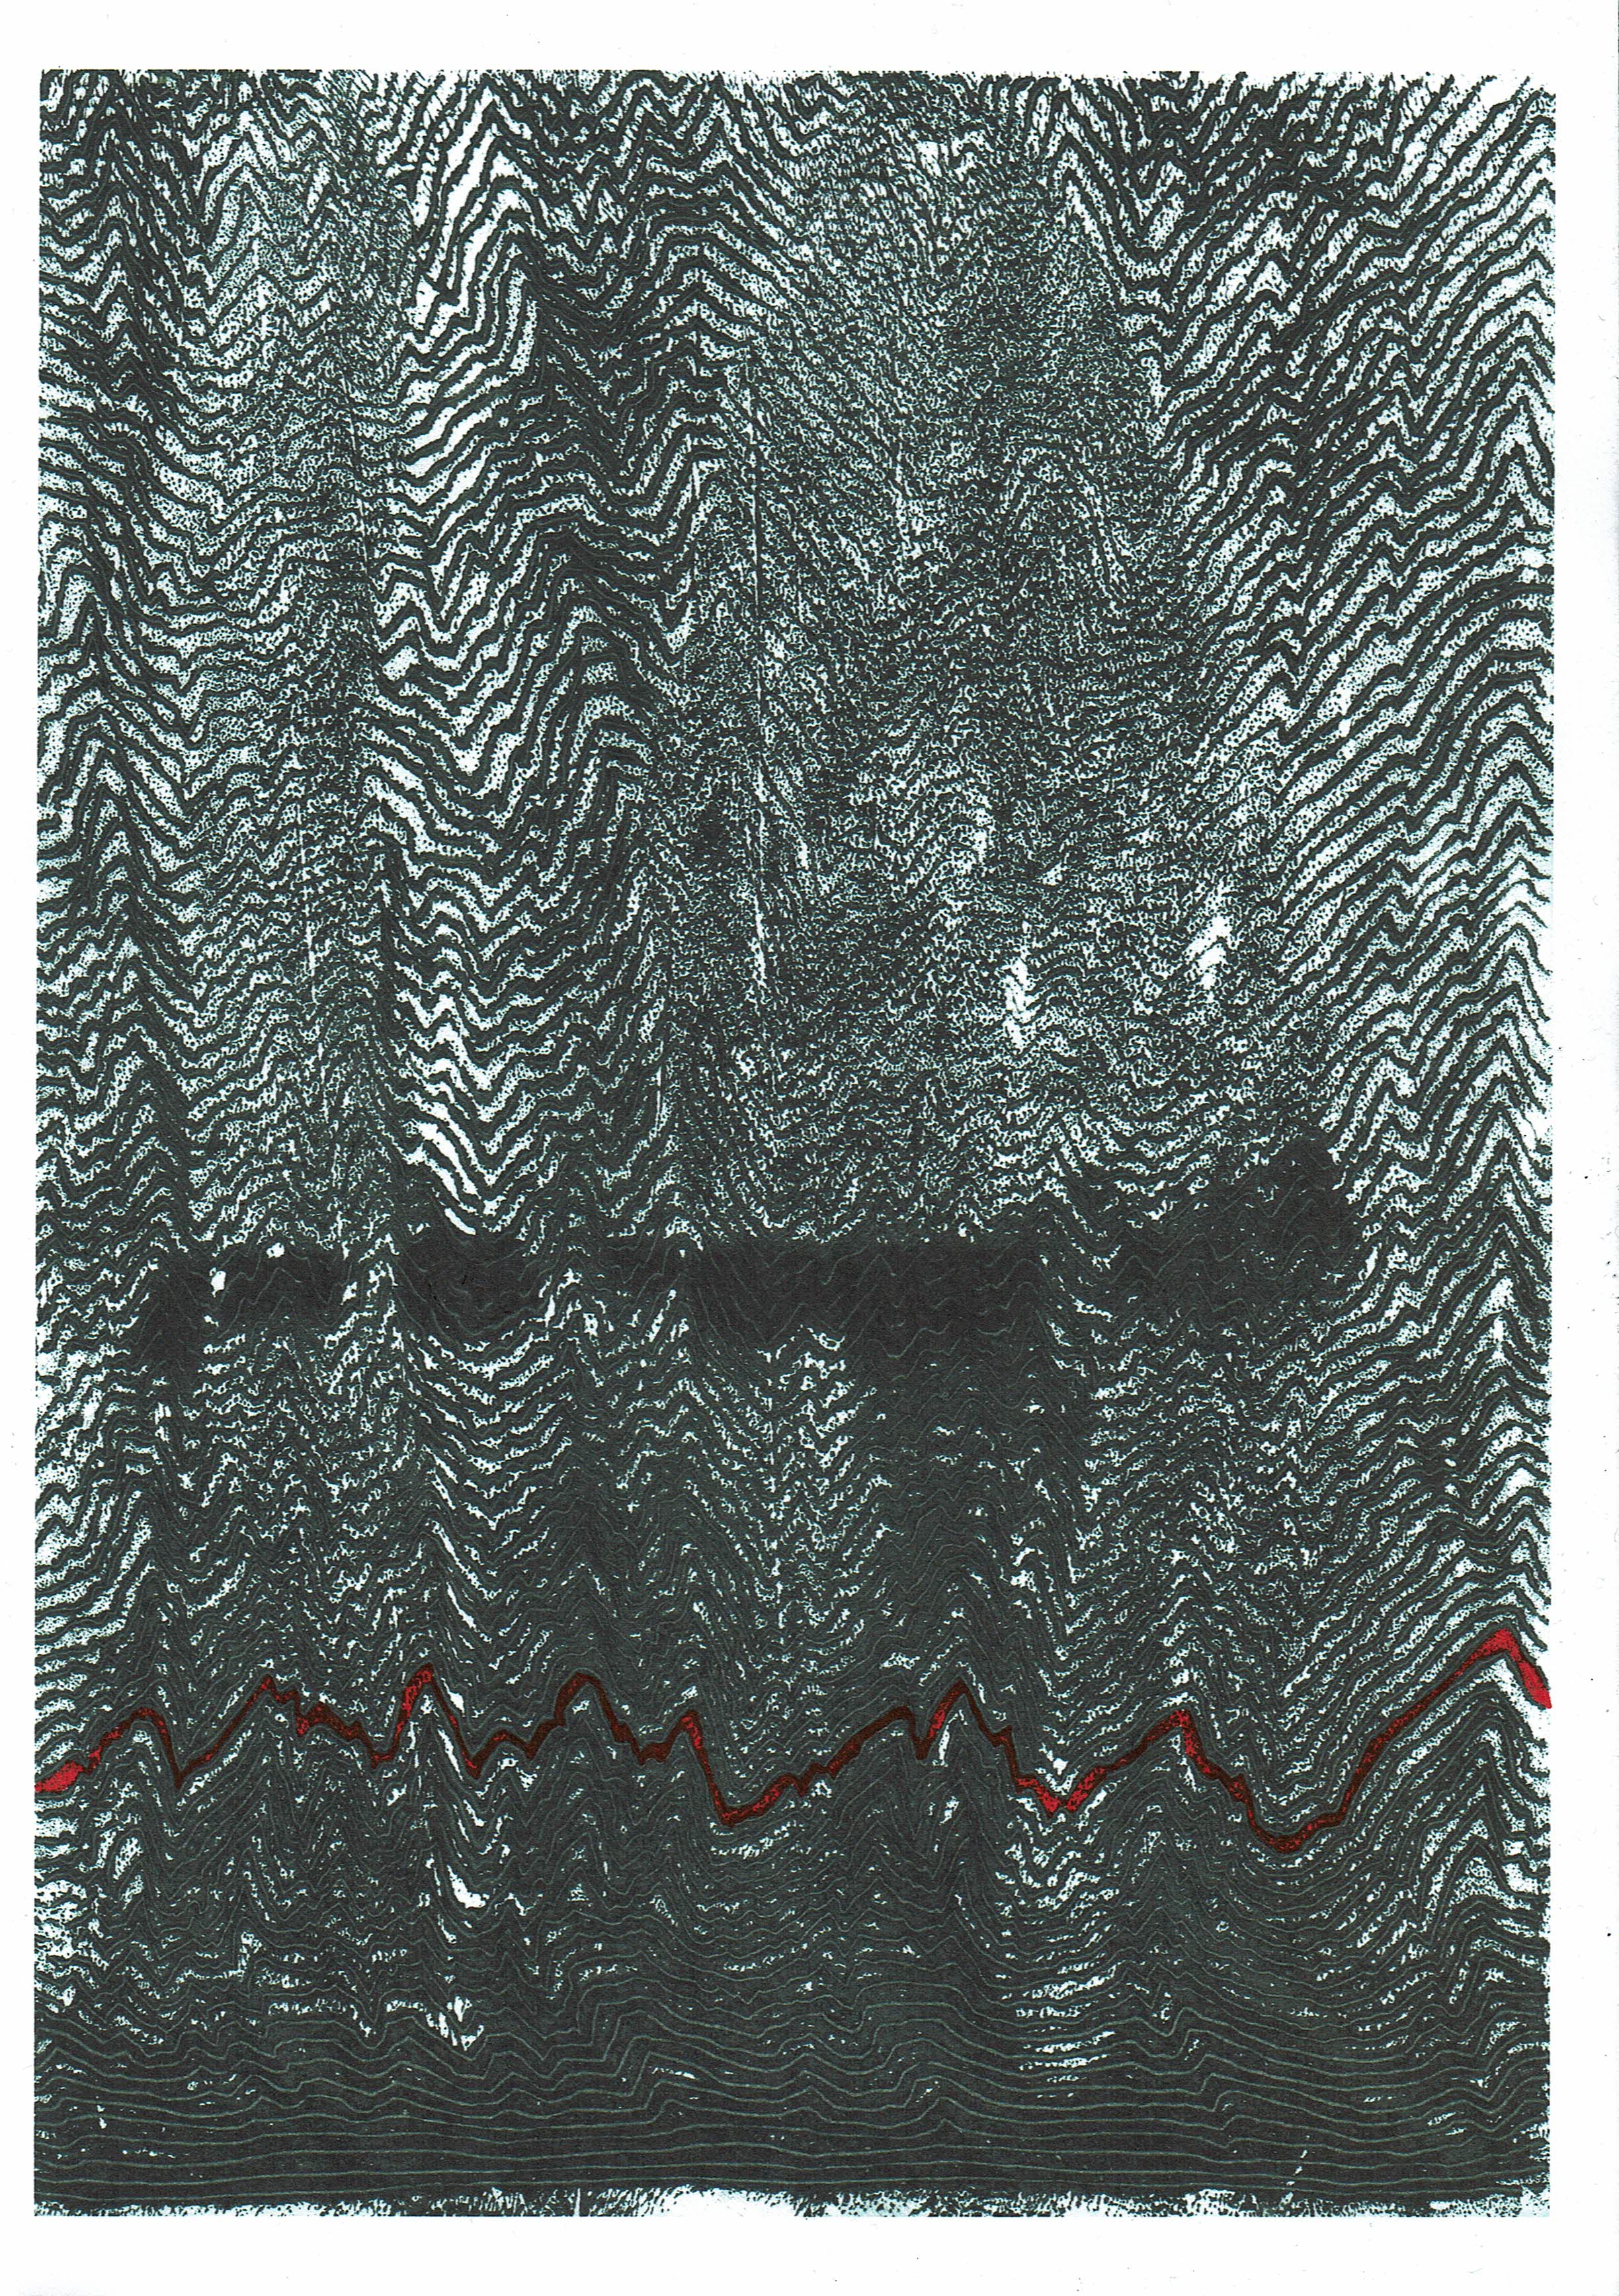
I also briefly tried incorporating another colour into the prints (using photocopies): the vague idea behind the use of a single red line stemmed from the link to graphs, and how most graphs to do with climate data nowadays usually contain some kind of red line – a cut-off point or a warning – which could maybe be visualised in these naturally-made graphs. This could link quite well with the idea I explored earlier whereby a small variation in a smaller ring gets exaggerated as the rings grow.
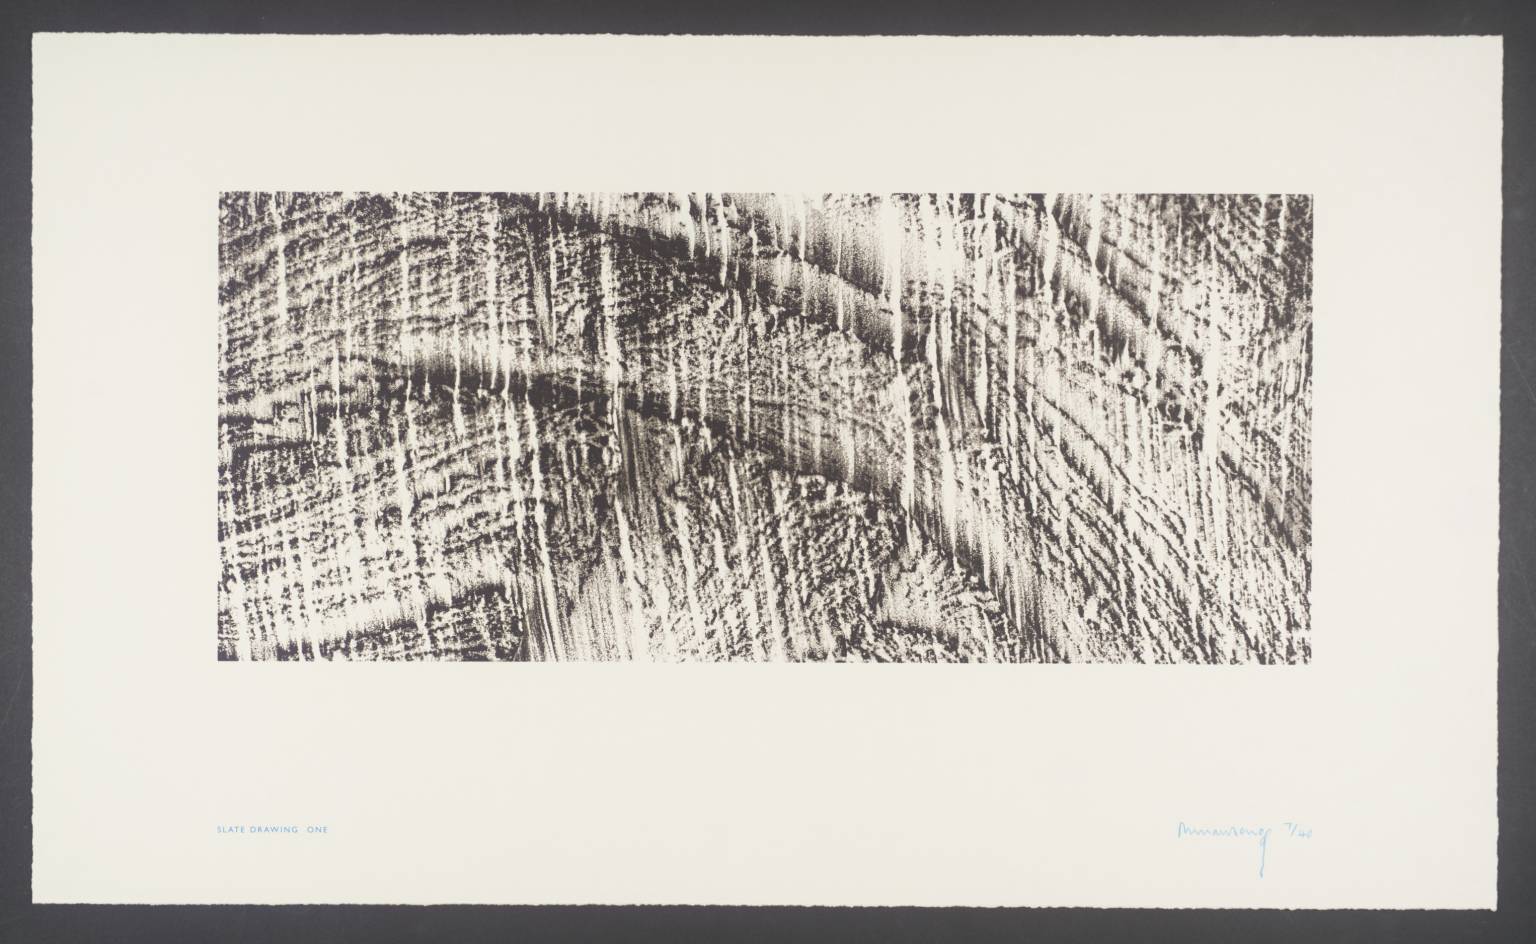
As a slight aside, these prints reminded me of a piece I saw recently in the Tate St Ives: Richard Long’s Cornish Slate Drawing. Having read a bit about the piece, and indeed Long’s practice in general, there are similarities between our work in terms of documentation of the landscape; he will often document his walks in the form of photos, texts and maps, and I am looking at how nature can form its own record. He will use natural materials to tell the story of a landscape, and stone is particularly good for this because “stones are what the world is made of” (stones would be another good material to look at, with the idea of different layers capturing different atmospheres from throughout the Earth’s history – in fact, these layers can be seen in Long’s slate drawings).