This new rock tracking piece has grown out of reflection on my previous (ongoing) rock tracking. In considering the ways in which I would present the piece – something I hadn’t considered to a great extent going into it – I realised that the resulting map would be one of the most effective outcomes. With having just the one rock, although the map neatly captures the idea of a rock ‘drawing’, it does not particularly convey quite the liveliness that I’d like it to. To counter this, in this new piece I have tracked 12 rocks. I wanted to get away from the singularity of one rock, feeling there was too much emphasis on the lone individual – the sky god (in Haraway’s terms) – which instead could be moved towards an awareness of a whole beach of materials on the move through following a multitude.
Whereas with my previous tracking I used a literal tracking device, with this one I simply painted the rocks white (with non-toxic/plastic paint) and numbered them for visual recognition instead:

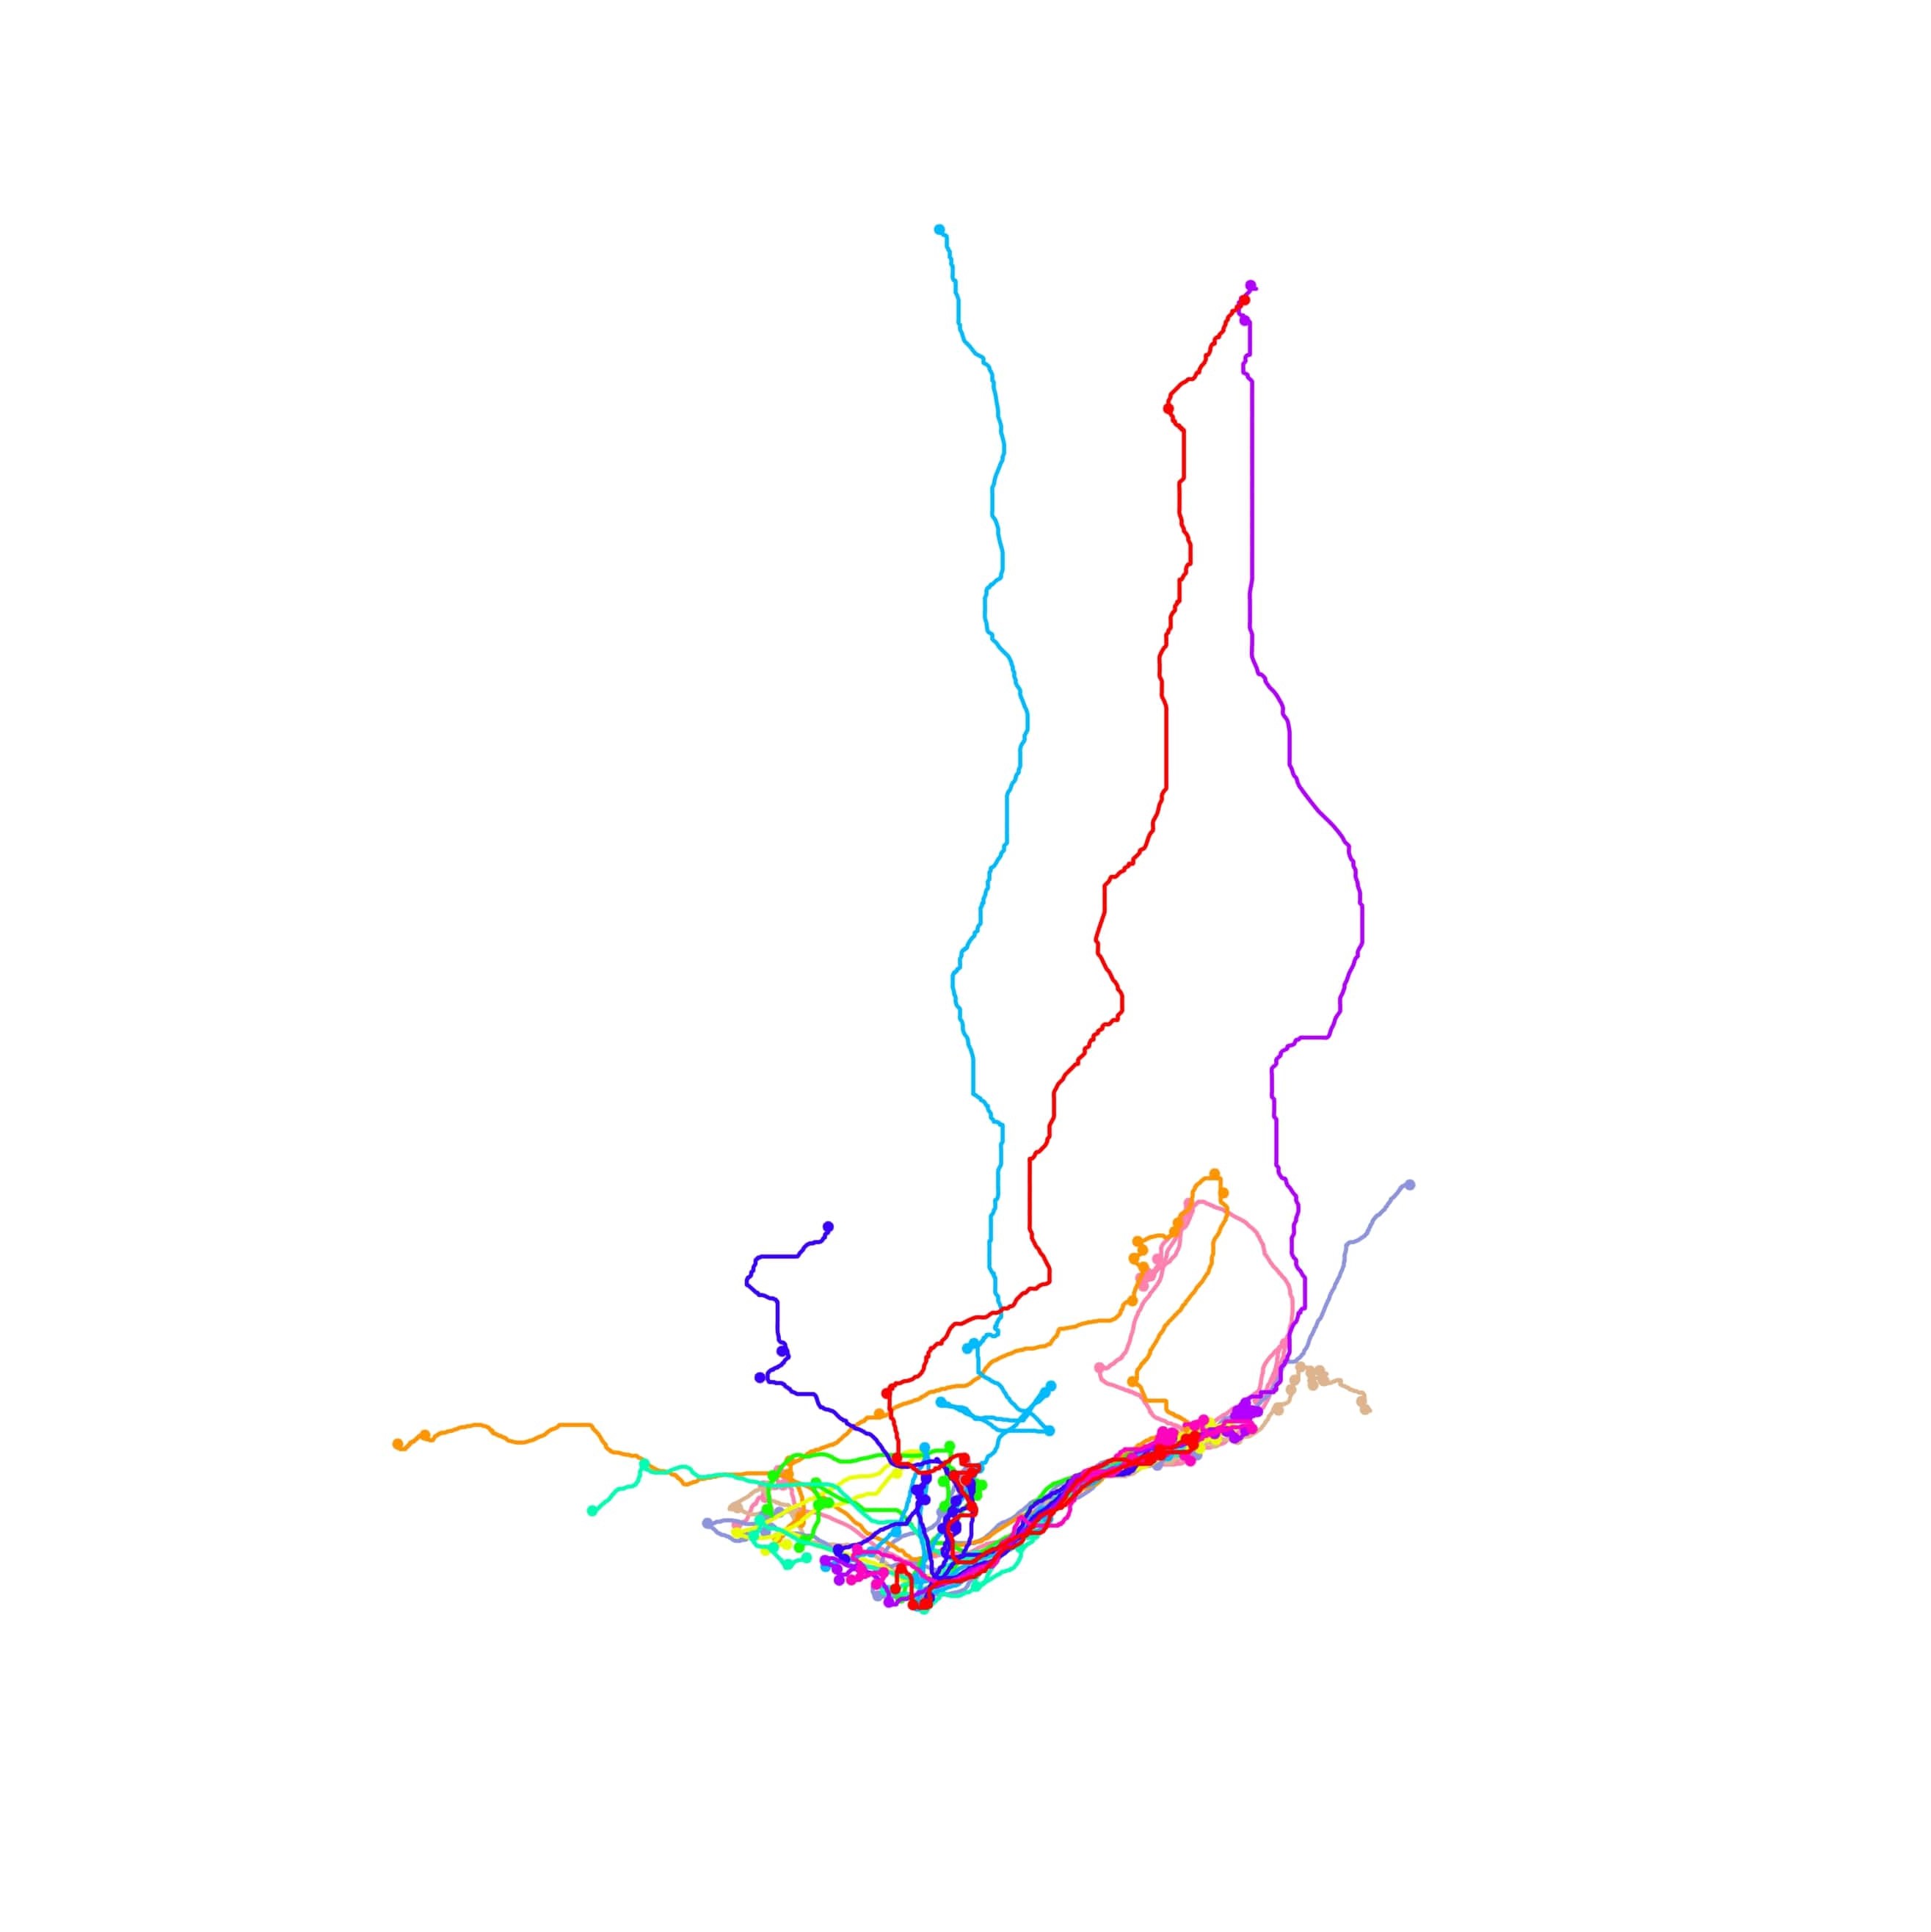
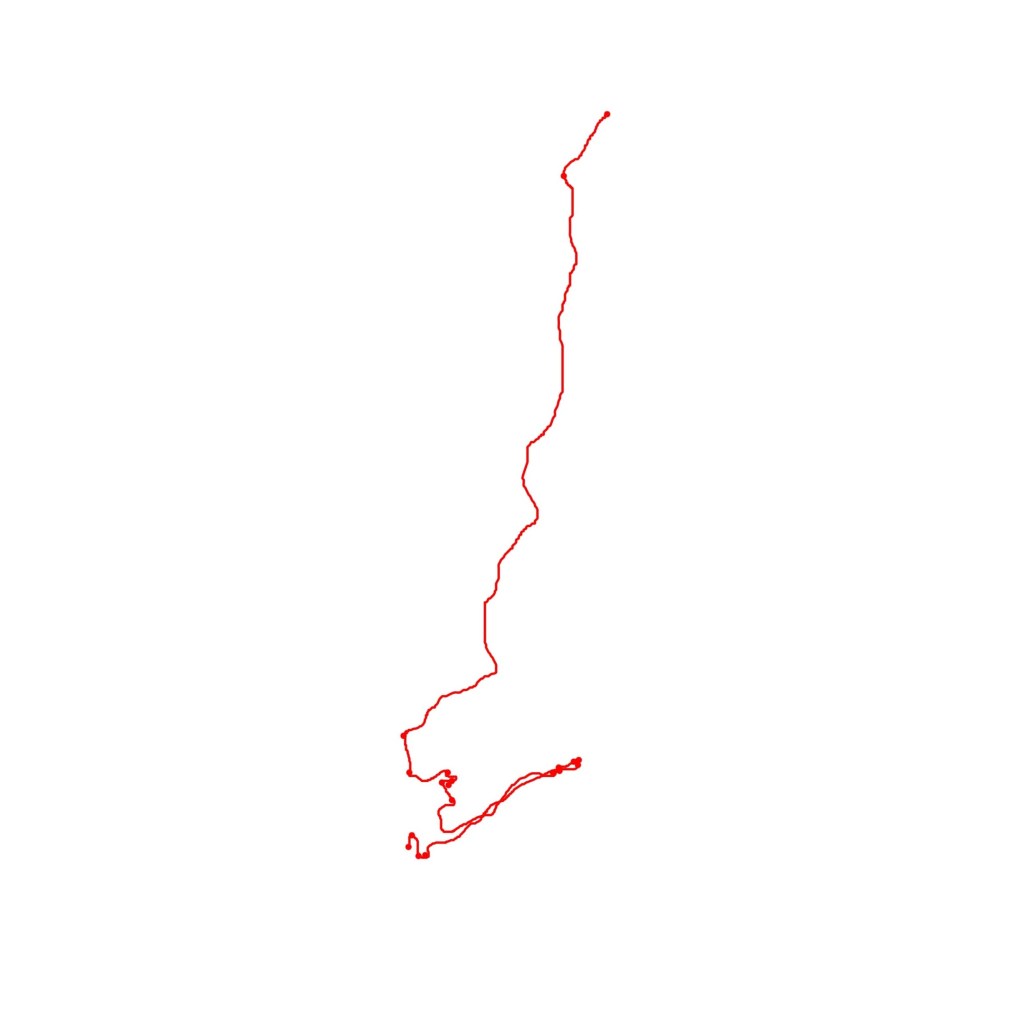
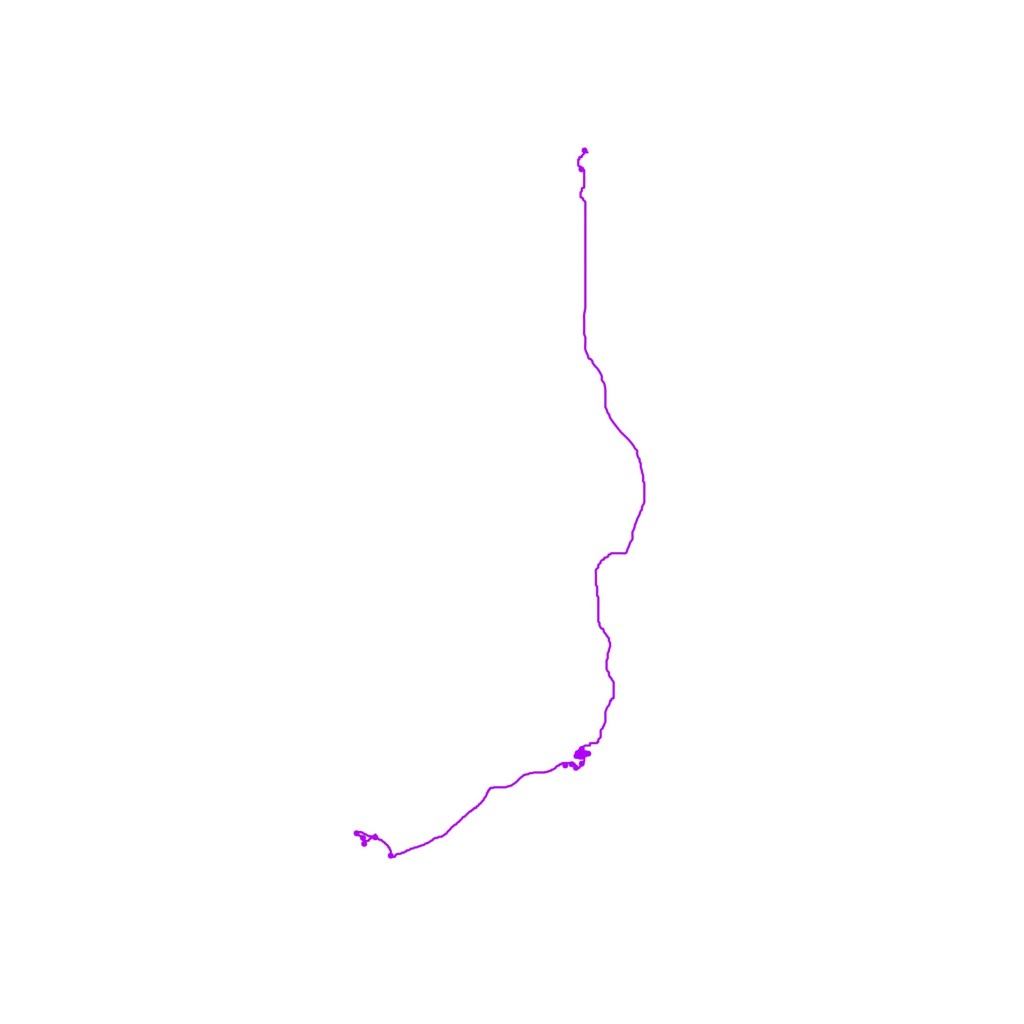
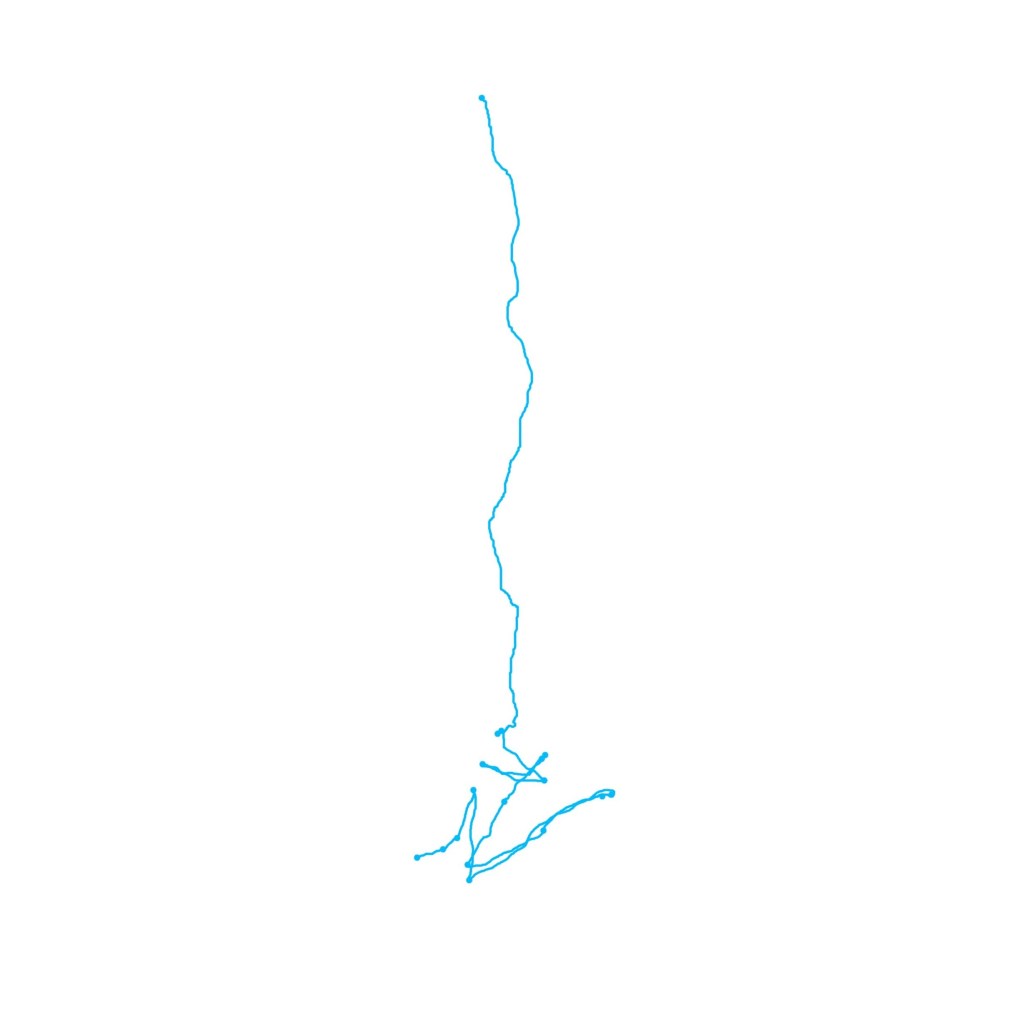
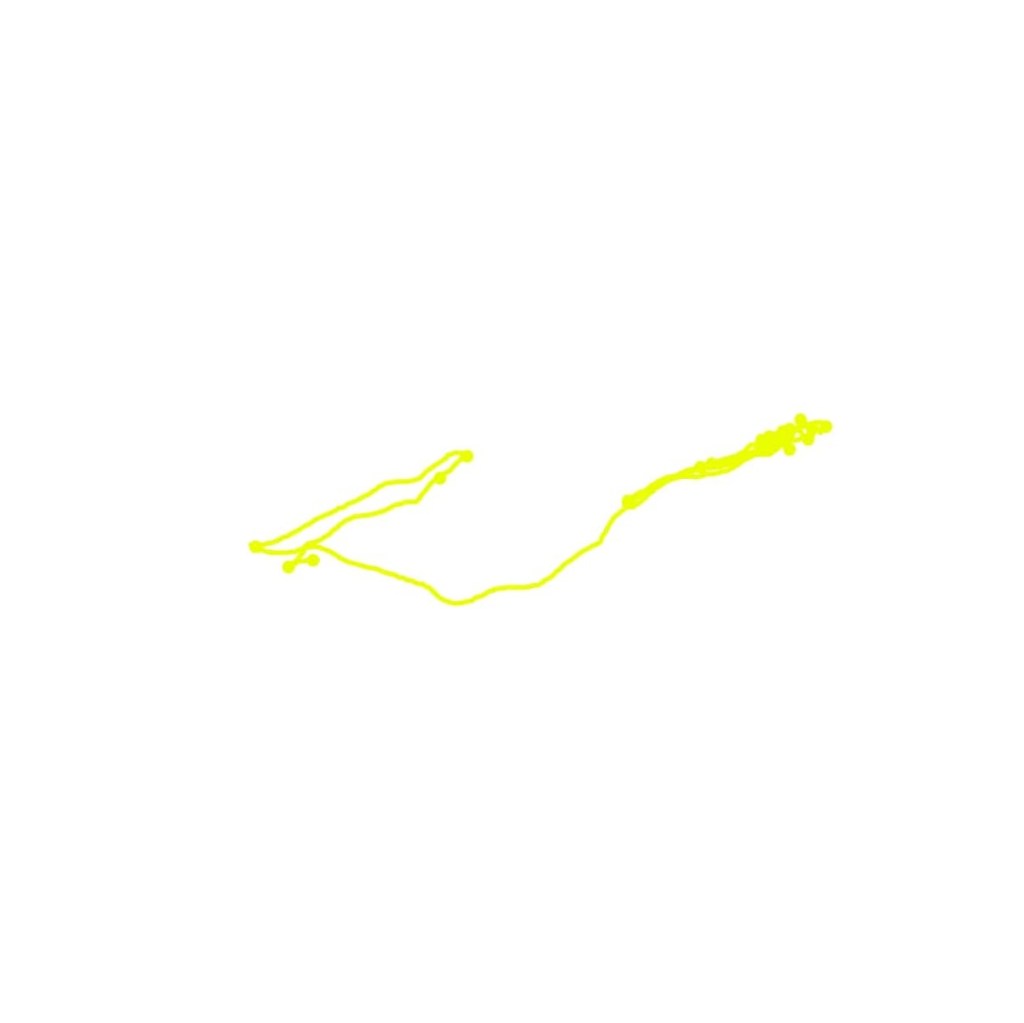
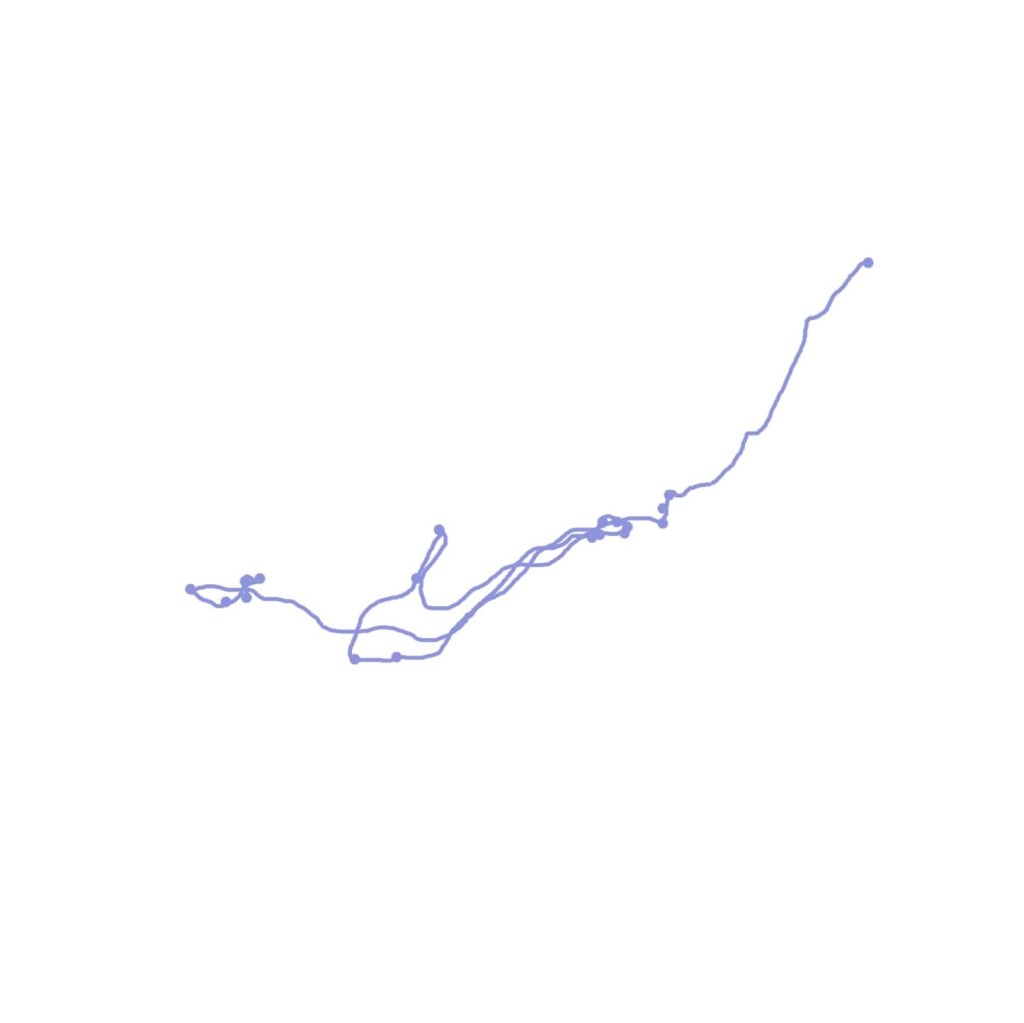
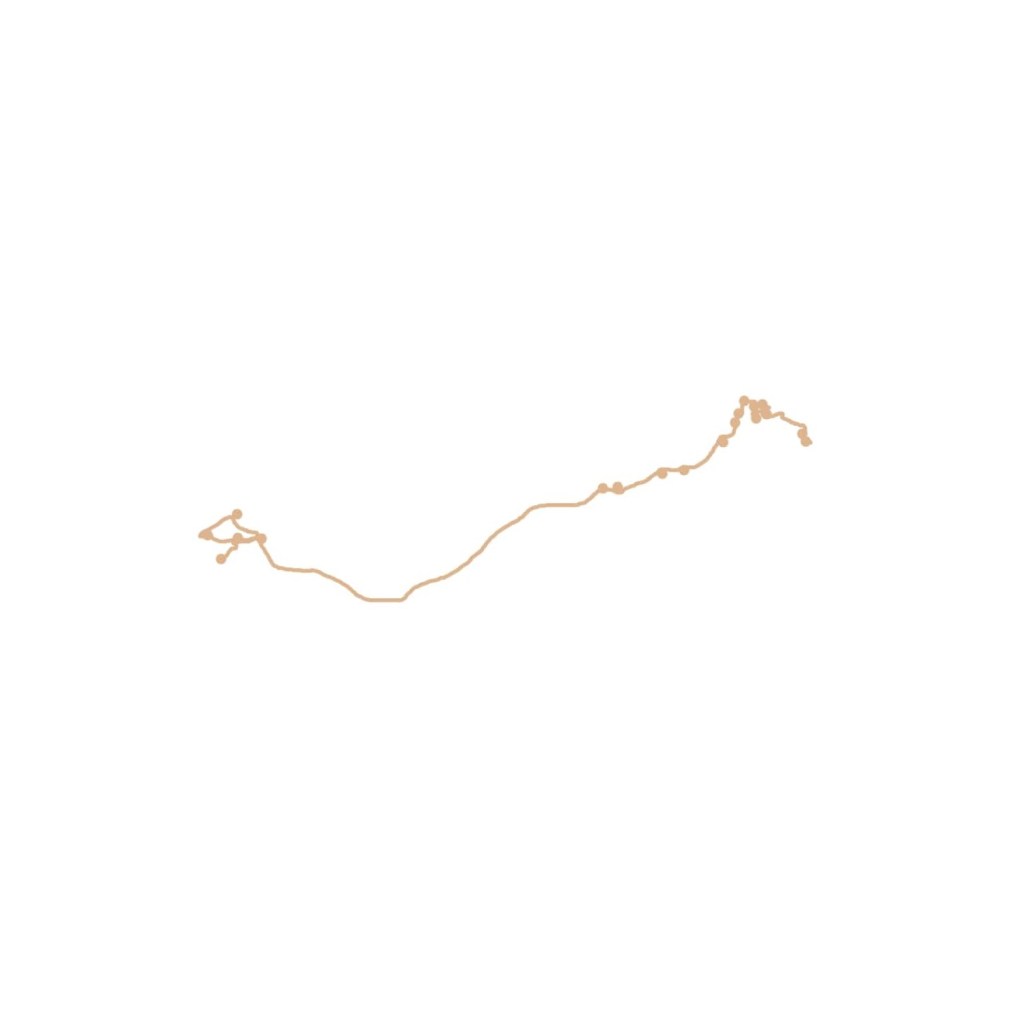
With the rocks being smaller and not digitally tracked they were undoubtedly going to last less time before I lost track of them. This piece has therefore only taken place over the span of a month, but I feel it has still provided a sufficient amount of data – below is the path each rock took:

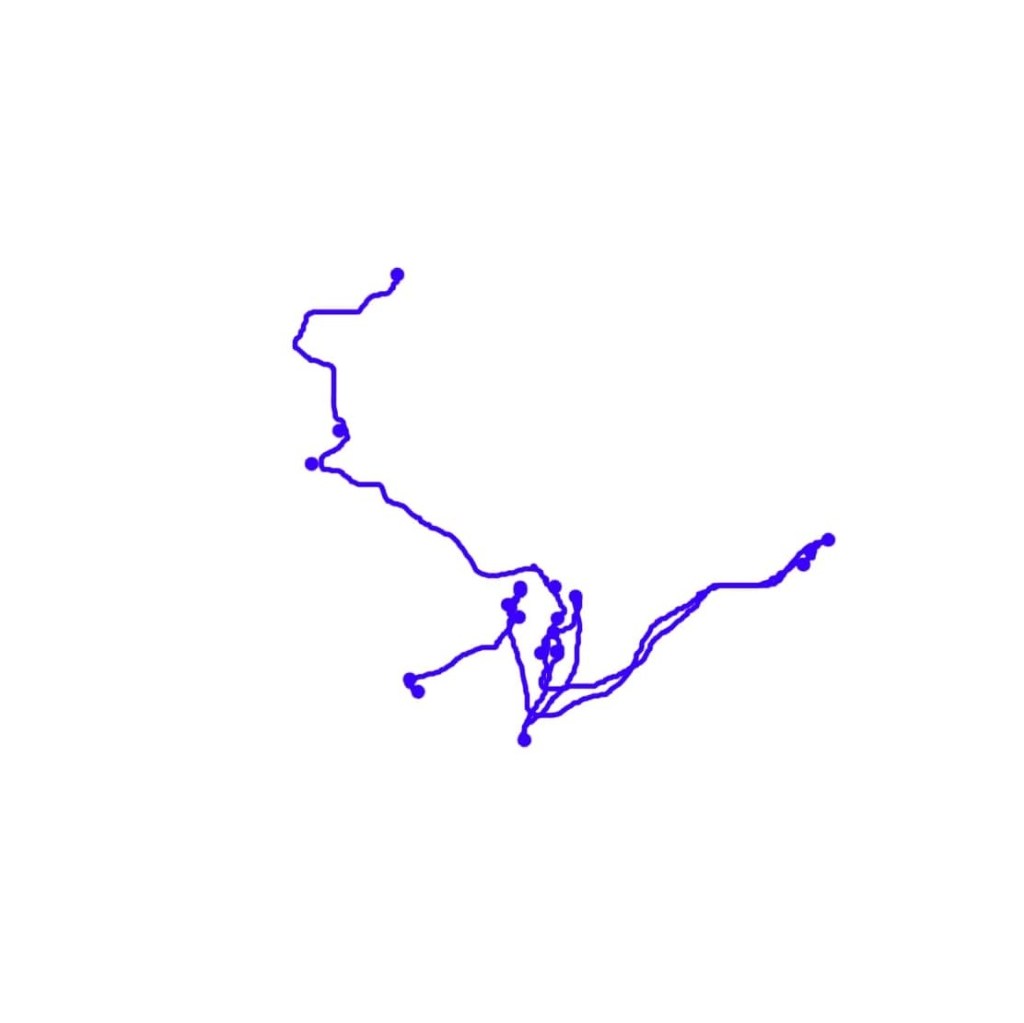


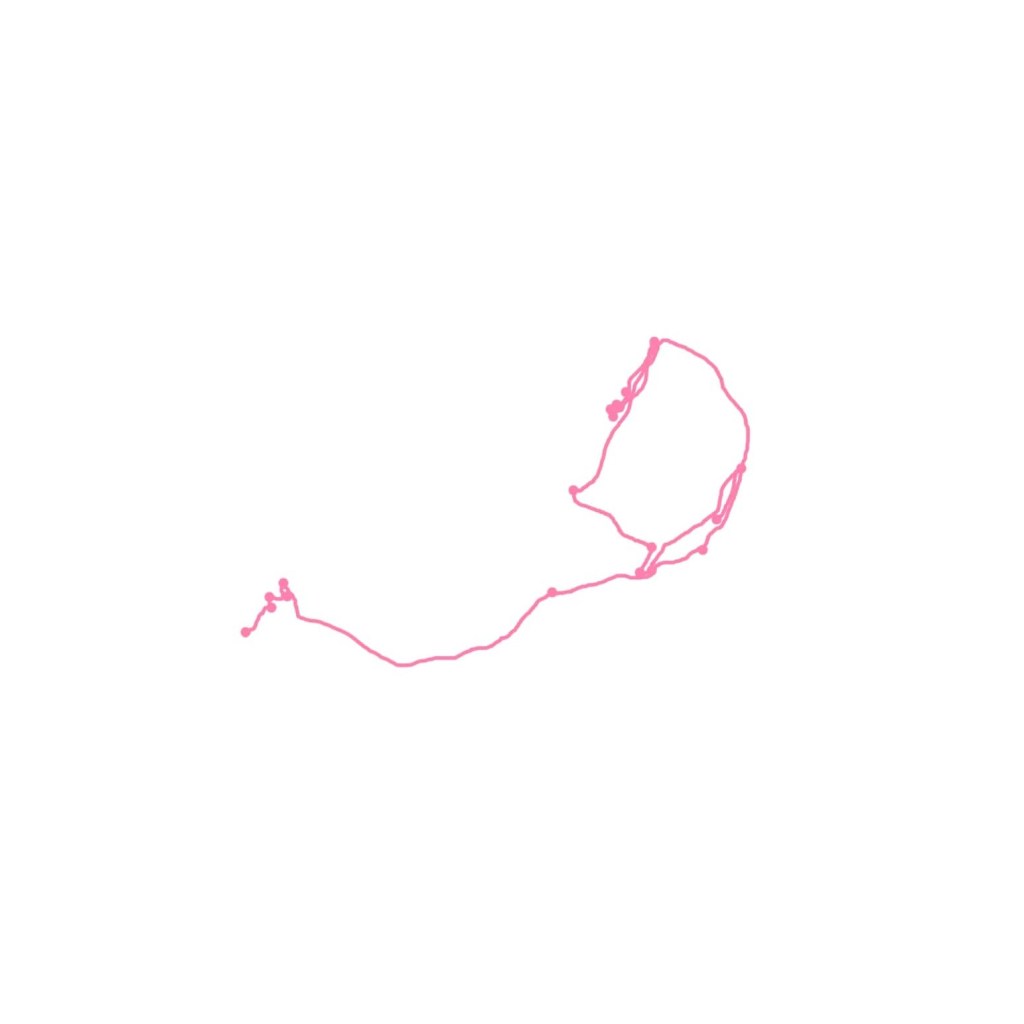
And then all together (first image shows location with dots representing each day, second is the compiled routes):


Whereas I struggled with the multitude of possible outcomes with the first tracking piece (photos, video, map, book etc), I feel with this one the outcome is a lot clearer. The map works really well in terms of conveying the story of the rock’s movement, capturing a real sense of a snapshot of the movement of the beach as a whole. Unlike the previous piece it would not make as much sense to have photos as the final documentation as 12 differing series would be quite an overwhelming and incoherent presentation of information.
On a practical level, manually keeping track of all 12 rocks was unsurprisingly difficult and time-consuming, hence the project’s limit to one month. I realised quite quickly that there were some small changes I could have made to ensure the project ran more smoothly/easily. I only labelled/numbered the rocks on one side, which when I was documenting their positions through photography meant it was often unclear what rock was what (I soon therefore labelled the other sides too!). However, further to this, in future I could consider simply distinguishing the rocks by painting them different colours rather than numbers. I chose white because it was easier to source a non-toxic paint in just one colour, and also I didn’t want to draw too much attention to the rocks in case it drew someone to interfere with them in some way. However, it may at least be worth trying this alternative approach and seeing what the outcome is/if it makes it any easier. I would have also helped myself considerably had I plotted the information as I went along. As it was I had to piece together the map from hundreds of photos at the end of the project which was perhaps unnecessarily difficult and time-consuming!
The only other outcome that may be effective would be an animation of the journeys growing and spreading outwards over time. Equally, though, I could bring this into another project – perhaps one where I track a sculpture as it decomposes on the beach. It would be worth researching more into different tracking devices for this, however, to see if I can reduce the need for my physical, in-person monitoring and data compiling – now I have some experience of these kinds of artworks/processes I could approach e.g. other areas of the uni to see if they’d have any suggestions.
